Company Screener
The Company Screener helps you find high-quality companies based on fundamental analysis criteria. You set the standards — market cap, profitability, valuation, financial health, and growth — and the screener returns every company that passes your filters, displayed in a sortable results table.
You can reach the screener from the main navigation at Screener > Companies, or directly at /screener/companies.
Filtering by fundamentals
Section titled “Filtering by fundamentals”The filters panel sits below the controls bar. Click it to expand the full configuration, or leave it collapsed to see a summary of your active filters as badges (for example, “Market Cap $10B - $1T+” or “P/E ≤ 35”).
Filters are organized into five tabs:
Fundamentals
Section titled “Fundamentals”- Market Cap — set a minimum and maximum range using a dual-handle slider ($2B to $1T+). This controls the size of companies returned.
- Maximum P/E Ratio — cap the price-to-earnings ratio (0-100). Lower values surface cheaper stocks relative to their earnings.
- Minimum Earnings Yield — set a floor for earnings yield (0-20%). Earnings yield is the inverse of P/E, so higher is better.
- EPS Growth YoY — set a range for year-over-year earnings-per-share growth (-50% to 100%).
Profitability
Section titled “Profitability”- ROE (Return on Equity) — minimum threshold (0-50%). Measures how efficiently a company generates profit from shareholder equity.
- ROIC (Return on Invested Capital) — minimum threshold (0-40%). Measures how well a company allocates capital to profitable investments.
- Gross Margin — minimum threshold (0-100%). Higher gross margins indicate pricing power.
- Operating Margin — minimum threshold (0-50%). Shows what percentage of revenue remains after operating expenses.
- EBITDA Margin — minimum threshold (0-50%). A proxy for operating cash flow efficiency.
Valuation
Section titled “Valuation”- Maximum Price to Sales (P/S) — cap the price-to-sales ratio (0-20x).
- Maximum Price to Tangible Book — cap the price-to-tangible-book ratio (0-20x).
- Maximum EV/EBITDA — cap the enterprise-value-to-EBITDA ratio (0-50x).
- Maximum EV/Revenue — cap the enterprise-value-to-revenue ratio (0-20x).
Health
Section titled “Health”- Current Ratio — minimum threshold (0-5). Values above 1 mean the company can cover short-term obligations.
- Quick Ratio (Acid Test) — minimum threshold (0-5). A stricter liquidity test that excludes inventory.
- Maximum Debt-to-Equity — cap the debt-to-equity ratio (0-5x). Lower values indicate less leverage.
- Maximum Debt-to-EBITDA — cap the debt-to-EBITDA ratio (0-10x). Measures how many years of EBITDA it would take to pay off all debt.
- Altman Z-Score — minimum threshold (0-5). Scores above 3.0 indicate low bankruptcy risk; below 1.8 signals distress.
Growth
Section titled “Growth”- Dividend Yield — set a range (0-10%). Useful for targeting income-paying stocks without chasing unsustainably high yields.
- Dividend Payout Ratio — set a range (0-100%). A payout ratio above 80% may be unsustainable.
- Revenue Growth YoY — set a range (-50% to 100%). Filters by year-over-year revenue growth.
You can also filter by Sector using the dropdown at the bottom of the panel. Choose from All Sectors, Technology, Healthcare, Financials, Consumer Discretionary, Consumer Staples, Industrials, Energy, Utilities, Real Estate, Materials, or Communication Services.
Each filter has an Enable checkbox. Disabled filters are ignored entirely, so you only screen on the criteria you care about. After adjusting filters, click Save Changes to apply them. Click Cancel to discard your edits.
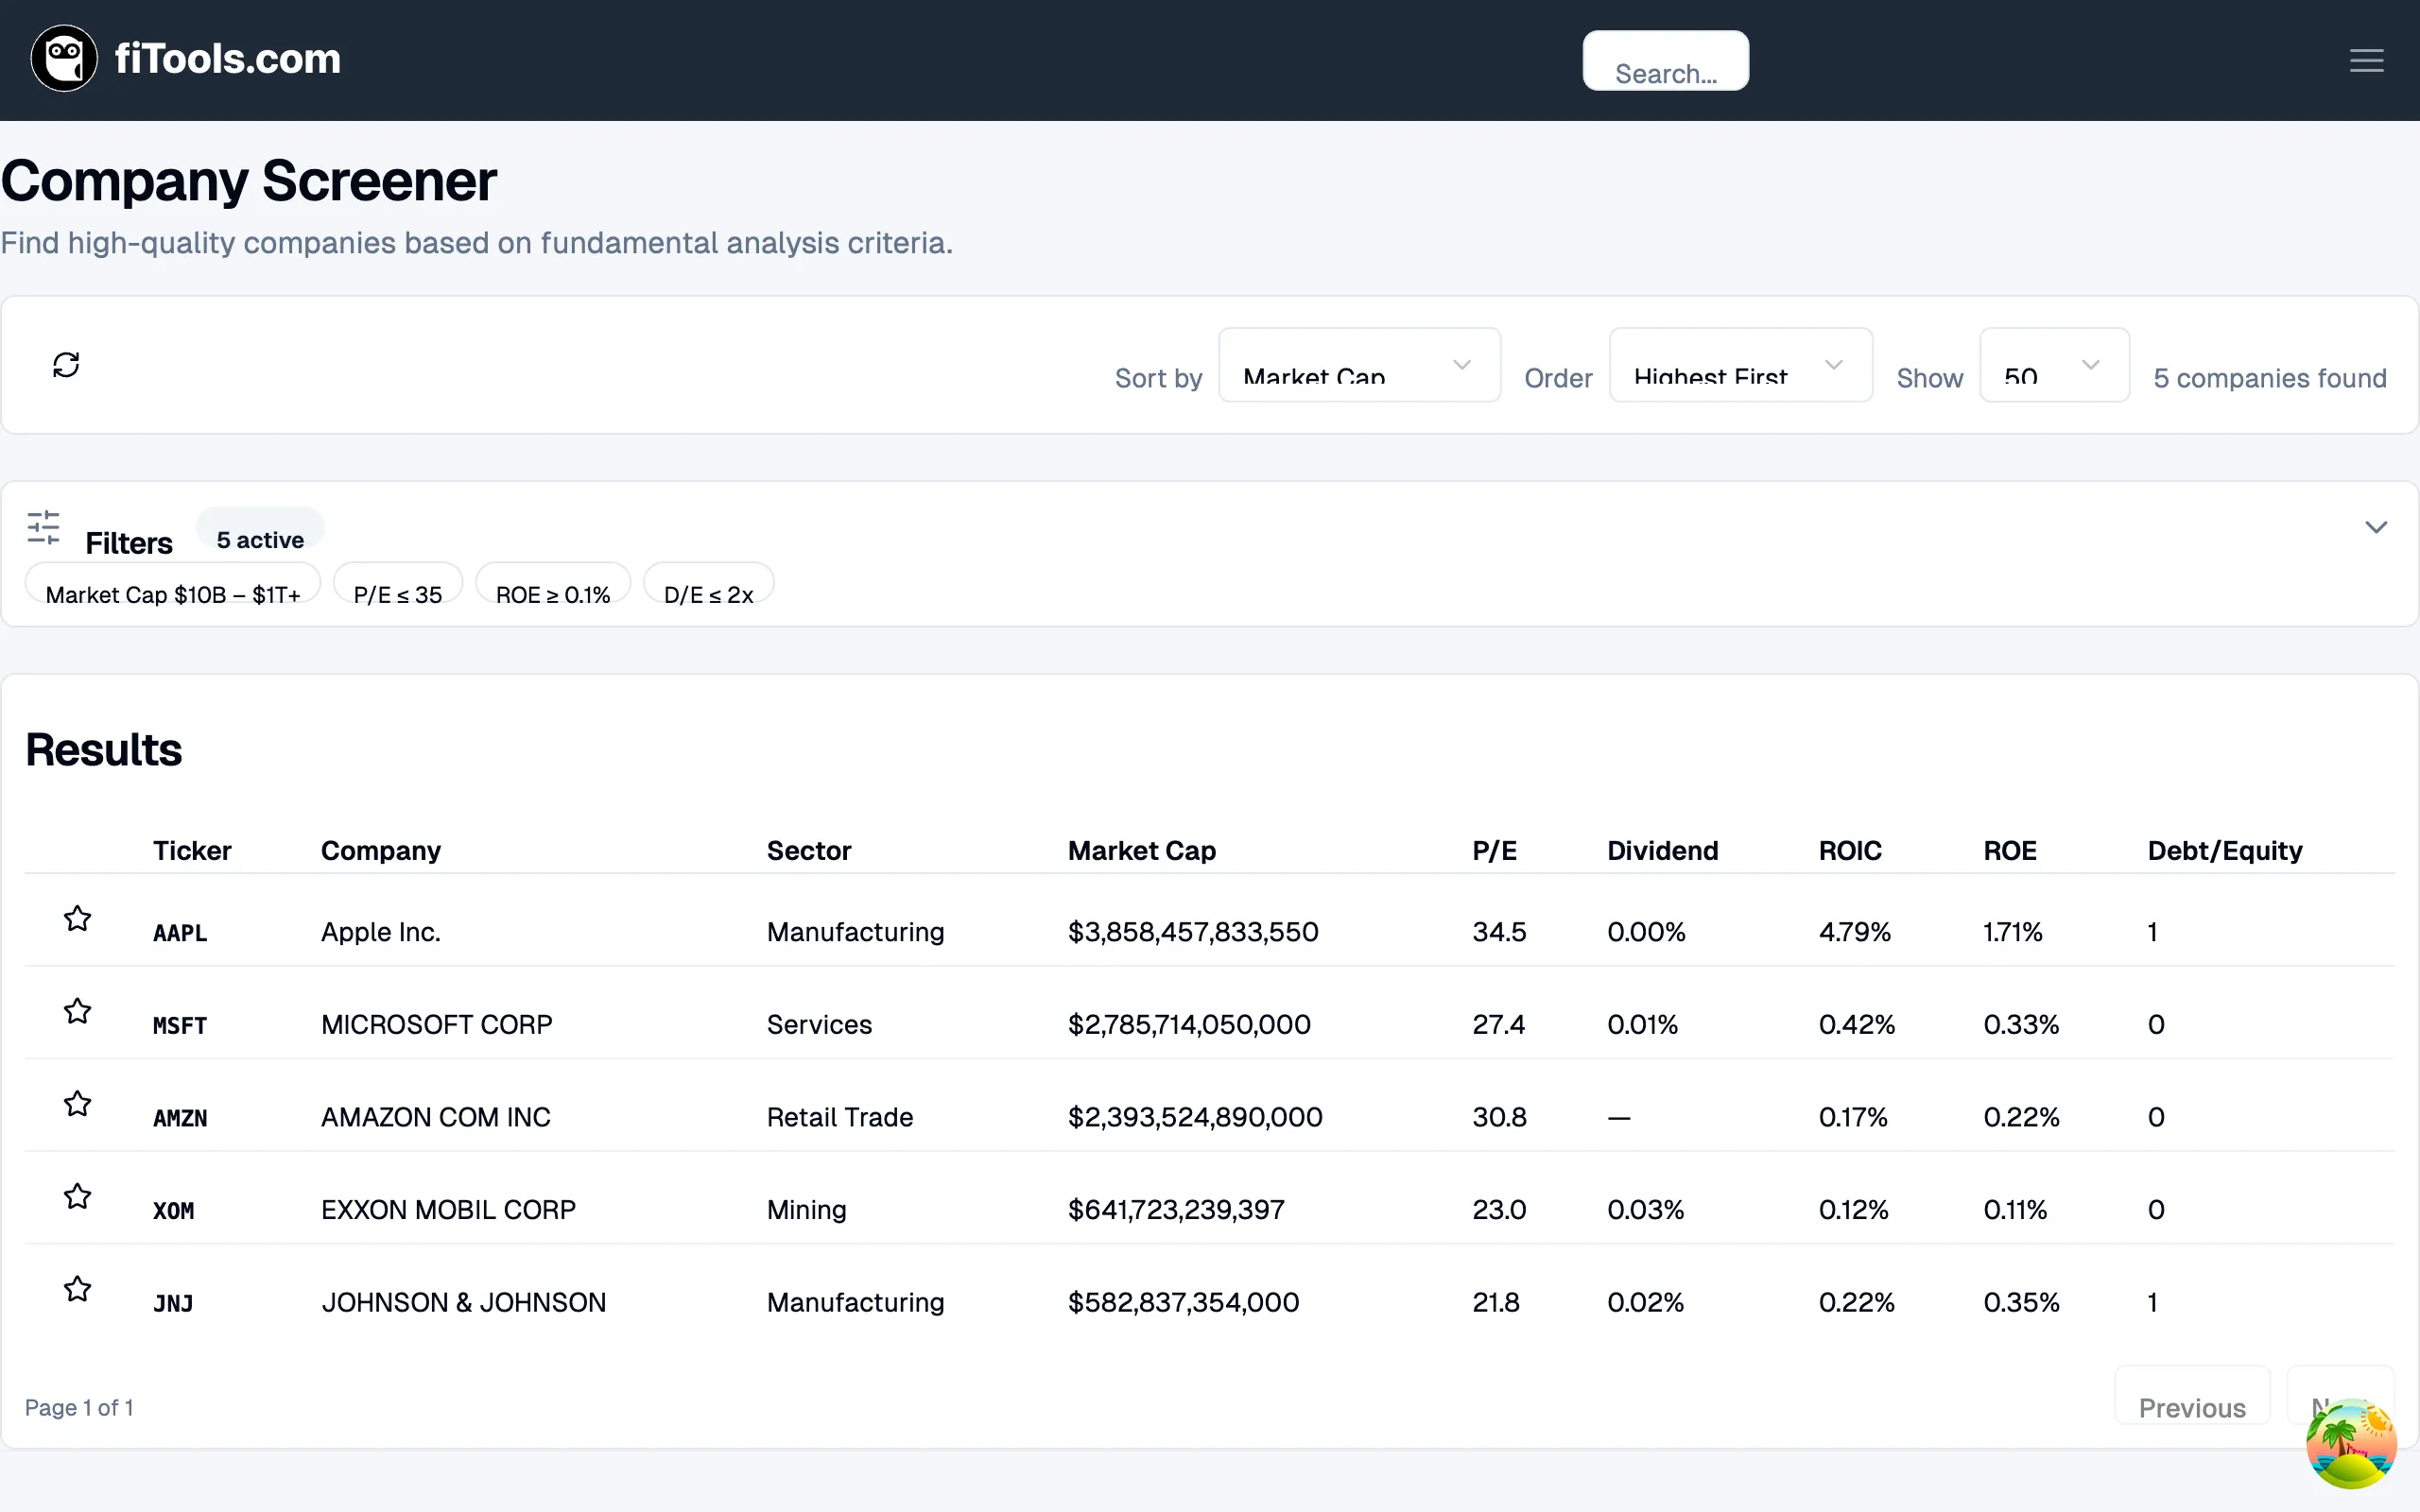
Understanding the results table
Section titled “Understanding the results table”The results table shows every company that passes your active filters. Each row displays:
| Column | What it shows |
|---|---|
| Star icon | Click to add or remove the company from your watchlist |
| Ticker | Stock symbol, linked to the full ticker detail page |
| Company | Full company name |
| Sector | Industry sector (Technology, Healthcare, etc.) |
| Market Cap | Total market capitalization in USD |
| P/E | Price-to-earnings ratio |
| Dividend | Dividend yield as a percentage |
| ROIC | Return on invested capital as a percentage |
| ROE | Return on equity as a percentage |
| Debt/Equity | Debt-to-equity ratio |
Click any ticker symbol to navigate to its detail page, where you can view historical data, financials, and options chains.
Sorting and comparing
Section titled “Sorting and comparing”Use the controls bar at the top of the page to sort and paginate your results.
- Sort by — choose which metric to sort on. Options include Market Cap, P/E Ratio, ROIC, ROE, Revenue Growth YoY, EPS Growth YoY, Debt to Equity, Ticker, and Company Name.
- Order — choose Highest First (descending) or Lowest First (ascending).
- Show — control how many results appear per page (25, 50, or 100).
- Refresh — click the refresh icon to re-fetch the latest data from the server.
The total number of matching companies appears on the right side of the controls bar. Use the Previous and Next buttons at the bottom of the results to navigate between pages.
Adding to your watchlist
Section titled “Adding to your watchlist”Each row in the results table has a star icon on the left. Click it to add the company to your watchlist. Click it again to remove it. The star fills in when a ticker is on your watchlist.
Your watchlist persists across sessions and is shared with the Options Screener. When you switch to the Options Screener and choose From Watchlist as your security source, every company you starred here flows into your options search automatically.
Related pages
Section titled “Related pages”- Options Screener — find covered call and cash-secured put opportunities scored by yield, protection, time decay, and liquidity