Ticker Details
The Ticker Details page is your single destination for researching a stock or ETF before making a trade. It combines price action, company fundamentals, the full options chain, scored option highlights, and your personal watchlist into one scrollable view.
You can reach it by navigating to /ticker/AAPL (replace AAPL with any supported ticker), or by clicking a ticker symbol anywhere in the app.
Overview card
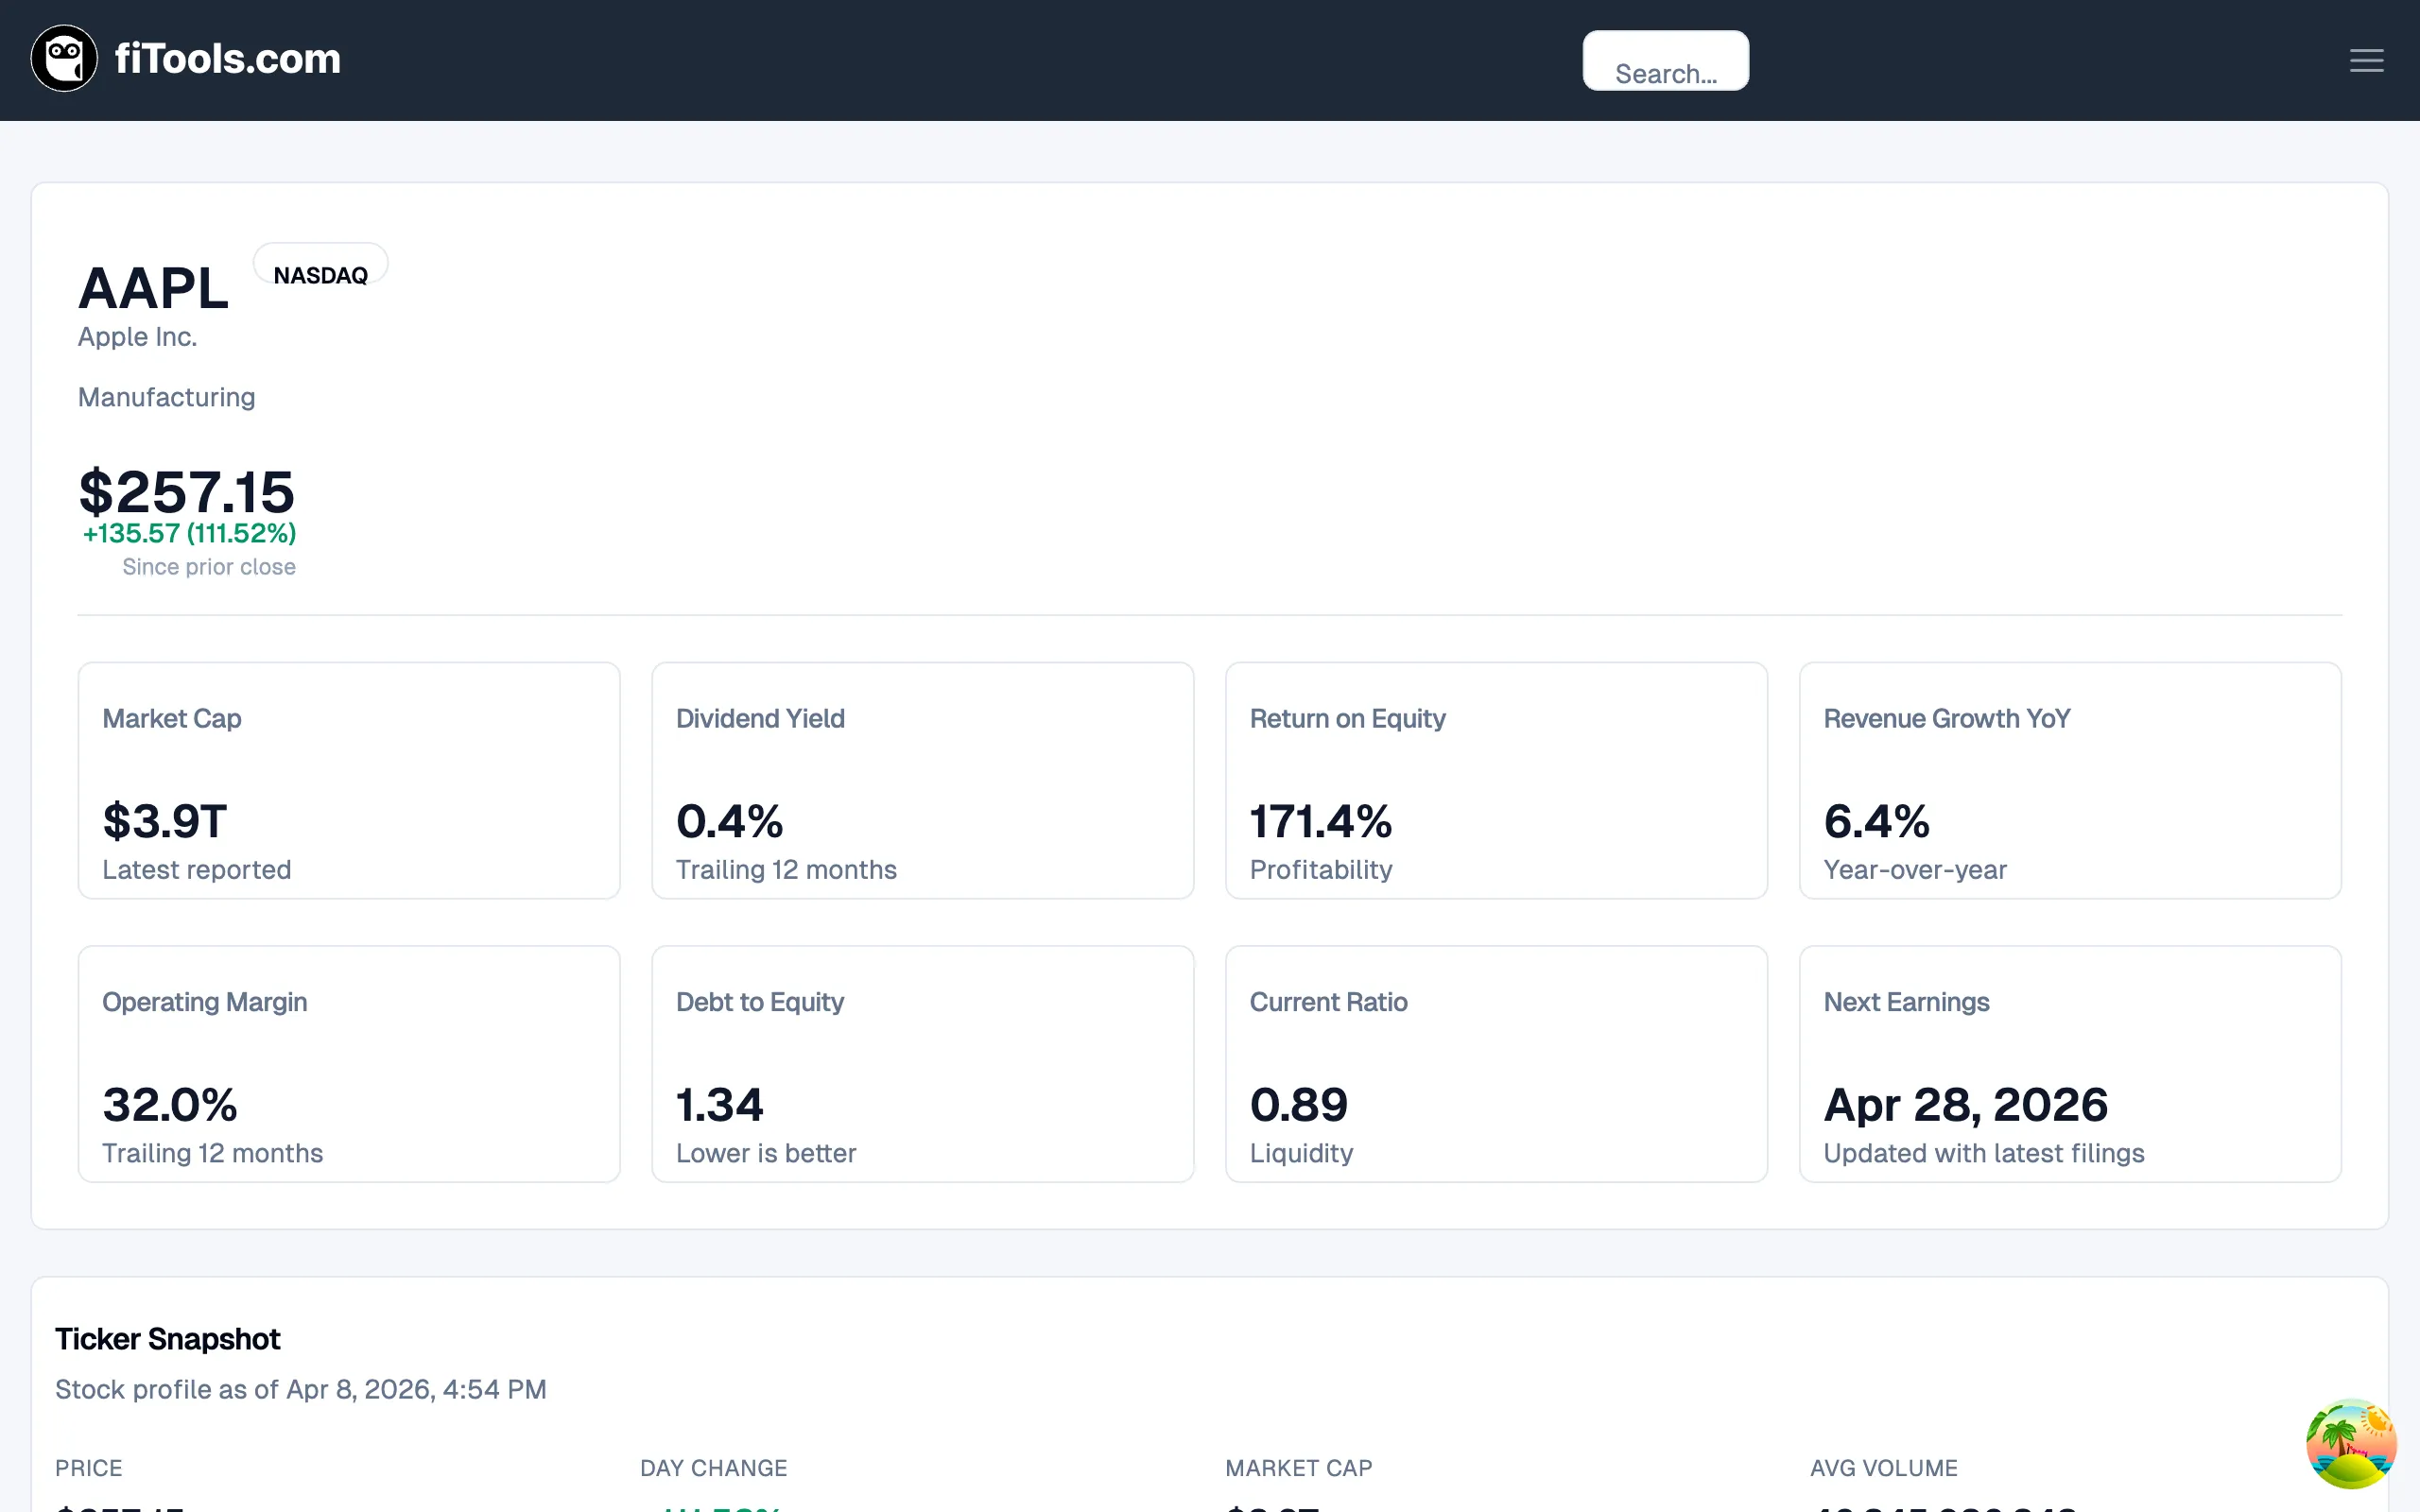
Section titled “Overview card”The overview card sits at the top of the page and gives you the headline numbers at a glance.
For stocks, the card displays eight metric tiles in two rows:
- Market Cap — latest reported market capitalization.
- Dividend Yield — trailing twelve-month yield.
- Return on Equity — profitability measure.
- Revenue Growth YoY — year-over-year revenue growth rate.
- Operating Margin — trailing twelve-month operating margin.
- Debt to Equity — leverage ratio (lower is better).
- Current Ratio — short-term liquidity.
- Next Earnings — the projected earnings announcement date, derived from the options chain.
For ETFs, the layout changes to a single row with four tiles:
- AUM — assets under management (in place of Market Cap).
- Distribution Yield — trailing twelve-month distribution yield (in place of Dividend Yield).
- Beta — volatility relative to the S&P 500.
- Avg Volume (30d) — average daily trading volume.
Ticker snapshot
Section titled “Ticker snapshot”Directly below the overview card, the Ticker Snapshot section shows four quick-reference data points for the current session:
- Price — the latest known price.
- Day Change — percentage change from the prior close, color-coded green (positive) or red (negative).
- Market Cap / AUM — market capitalization for stocks, assets under management for ETFs.
- Avg Volume — 30-day average daily volume.
The timestamp at the top of the card tells you when the data was last refreshed.
Option highlights
Section titled “Option highlights”The Option Highlights section surfaces the two highest-rated option contracts for the ticker — one covered call and one cash-secured put. These are scored by the same engine that powers the Options Screener.
Each highlight card shows:
- Score badge — a letter grade (A through F) with a numeric score out of 100.
- Contract details — strike price, expiration date, days to expiration, and open interest.
- Component score bars — individual scores for Income, Assignment, Liquidity, Vol Quality, and Tenor.
- Yield snapshot — annualized yield, bid/ask spread percentage, and implied volatility.
- Key levels — underlying price, strike price, and delta.
- Flags — warnings such as “Wide spread”, “Short DTE”, or “Earnings” when relevant.
- Up to 3 alternatives — other contracts that scored above the quality threshold, each with their own score, strike, DTE, and annualized yield.
Click Open option details to navigate to the full contract page, or Open in options screener to see all scored contracts for the ticker.
Price chart
Section titled “Price chart”The Price Performance section renders an interactive area chart of historical closing prices, covering up to five years of data.
Hover over the chart to see the exact price and date for any data point. The chart loads the full five-year history by default.
Business overview
Section titled “Business overview”The Business / Fund Overview card provides a short description of the company or fund along with contextual metadata:
- Sector — the company’s primary sector.
- Industry / Strategy — for stocks this shows the industry classification; for ETFs it shows the fund objective.
- Exchange — where the security is listed.
For ETFs, two additional fields appear:
- Issuer — the fund provider.
- Benchmark Index — the index the fund tracks.
Company fundamentals
Section titled “Company fundamentals”The Fundamentals card organizes financial metrics into five tabs. Click any tab to switch between categories. All values are based on the latest annual report.
Valuation tab
Section titled “Valuation tab”Measures how the market prices the company relative to its earnings, revenue, and assets:
| Metric | What it tells you |
|---|---|
| P/E | Price relative to earnings per share |
| P/S | Price relative to revenue per share |
| P/Tangible Book | Price relative to tangible book value |
| EV/EBITDA | Enterprise value relative to operating earnings |
| EV/Revenue | Enterprise value relative to total revenue |
Profitability tab
Section titled “Profitability tab”Shows how efficiently the company converts revenue into profit:
| Metric | What it tells you |
|---|---|
| ROIC | Return on invested capital |
| ROE | Return on shareholders’ equity |
| ROA | Return on total assets |
| Gross Margin | Revenue retained after cost of goods sold |
| Operating Margin | Revenue retained after operating expenses |
| Profit Margin | Revenue retained after all expenses |
Growth tab
Section titled “Growth tab”Tracks how quickly the company is expanding:
| Metric | What it tells you |
|---|---|
| Revenue YoY | Year-over-year revenue growth |
| Revenue 3Y | Three-year compound revenue growth |
| EPS YoY | Year-over-year earnings-per-share growth |
| EPS 3Y | Three-year compound EPS growth |
| Net Income YoY | Year-over-year net income growth |
Balance Sheet tab
Section titled “Balance Sheet tab”Evaluates the company’s financial health and solvency:
| Metric | What it tells you |
|---|---|
| Debt/Equity | Total debt relative to shareholder equity |
| Debt/EBITDA | Total debt relative to operating earnings |
| Current Ratio | Ability to pay short-term obligations |
| Quick Ratio | Ability to pay short-term obligations without inventory |
| Altman Z | Composite bankruptcy-risk score (higher is safer) |
Cash Flow tab
Section titled “Cash Flow tab”Assesses how the company generates and returns cash:
| Metric | What it tells you |
|---|---|
| Dividend Payout | Share of earnings paid as dividends |
| Earnings Yield | Inverse of P/E — earnings relative to price |
| Interest Coverage | Ability to service debt interest payments |
Financial history
Section titled “Financial history”The Financial History section visualizes annual data for the last three or more fiscal years as an interactive area chart. You can toggle between four metrics using the pill buttons above the chart:
- Revenue — total annual revenue in billions.
- Net Income — annual net income in billions.
- Free Cash Flow — annual free cash flow in billions.
- EPS (Basic) — basic earnings per share in dollars.
Each data point shows the year-over-year growth rate in the tooltip.
Options chain
Section titled “Options chain”The Options Chain section displays every available call and put contract for the ticker, organized by expiration date.
Use the expiration dropdown at the top to switch between available expiration dates. The page defaults to the nearest expiration that is at least 30 days out.
Calls and puts are shown side by side in separate tables. Each row includes:
| Column | Description |
|---|---|
| Strike | Strike price; an “Earnings” badge appears if the company reports before this expiration |
| Bid | Current bid price |
| Ask | Current ask price |
| Last | Last traded price |
| IV | Implied volatility as a percentage |
| Delta | Option delta (sensitivity to underlying price) |
| Volume | Contracts traded today |
| Open Int. | Total outstanding contracts |
| Details | Link to the full contract detail page |
Watchlist contracts
Section titled “Watchlist contracts”The Watchlist Contracts section shows option contracts you have previously saved for this ticker. These are bookmarked contracts, not executed trades.
Each row displays:
- Ticker — the underlying symbol.
- Type — Call or Put badge.
- Strike — the contract strike price.
- Expiration — the contract expiration date.
- Added — when you saved the contract.
- Source — always “Watchlist” for saved contracts.
- Notes — any notes you attached when saving.
You can click View to open the full contract detail page, or Remove to delete the contract from your watchlist.
If you have not saved any contracts for this ticker, the section shows a message confirming there are no active watchlist contracts.
Dividends and distributions
Section titled “Dividends and distributions”If the ticker pays dividends (stocks) or distributions (ETFs), a final card appears at the bottom of the page.
The card shows:
- Trailing Yield — the trailing twelve-month dividend or distribution yield.
- Payout Ratio — the percentage of earnings paid out as dividends.
Related pages
Section titled “Related pages”- Options Screener — find scored covered call and cash-secured put opportunities
- How Covered Calls Work — learn the mechanics behind selling covered calls
- How Cash-Secured Puts Work — understand cash-secured put strategy
- Choosing Strikes and Expirations — guidance on selecting the right strike and expiration