Options Screener
The Options Screener scores and ranks options contracts across your chosen universe of stocks and ETFs. It finds covered call and cash-secured put opportunities, then presents the best contract per ticker along with alternatives you can compare side by side.
You can reach the screener at Screener > Options in the main navigation.
Controls bar
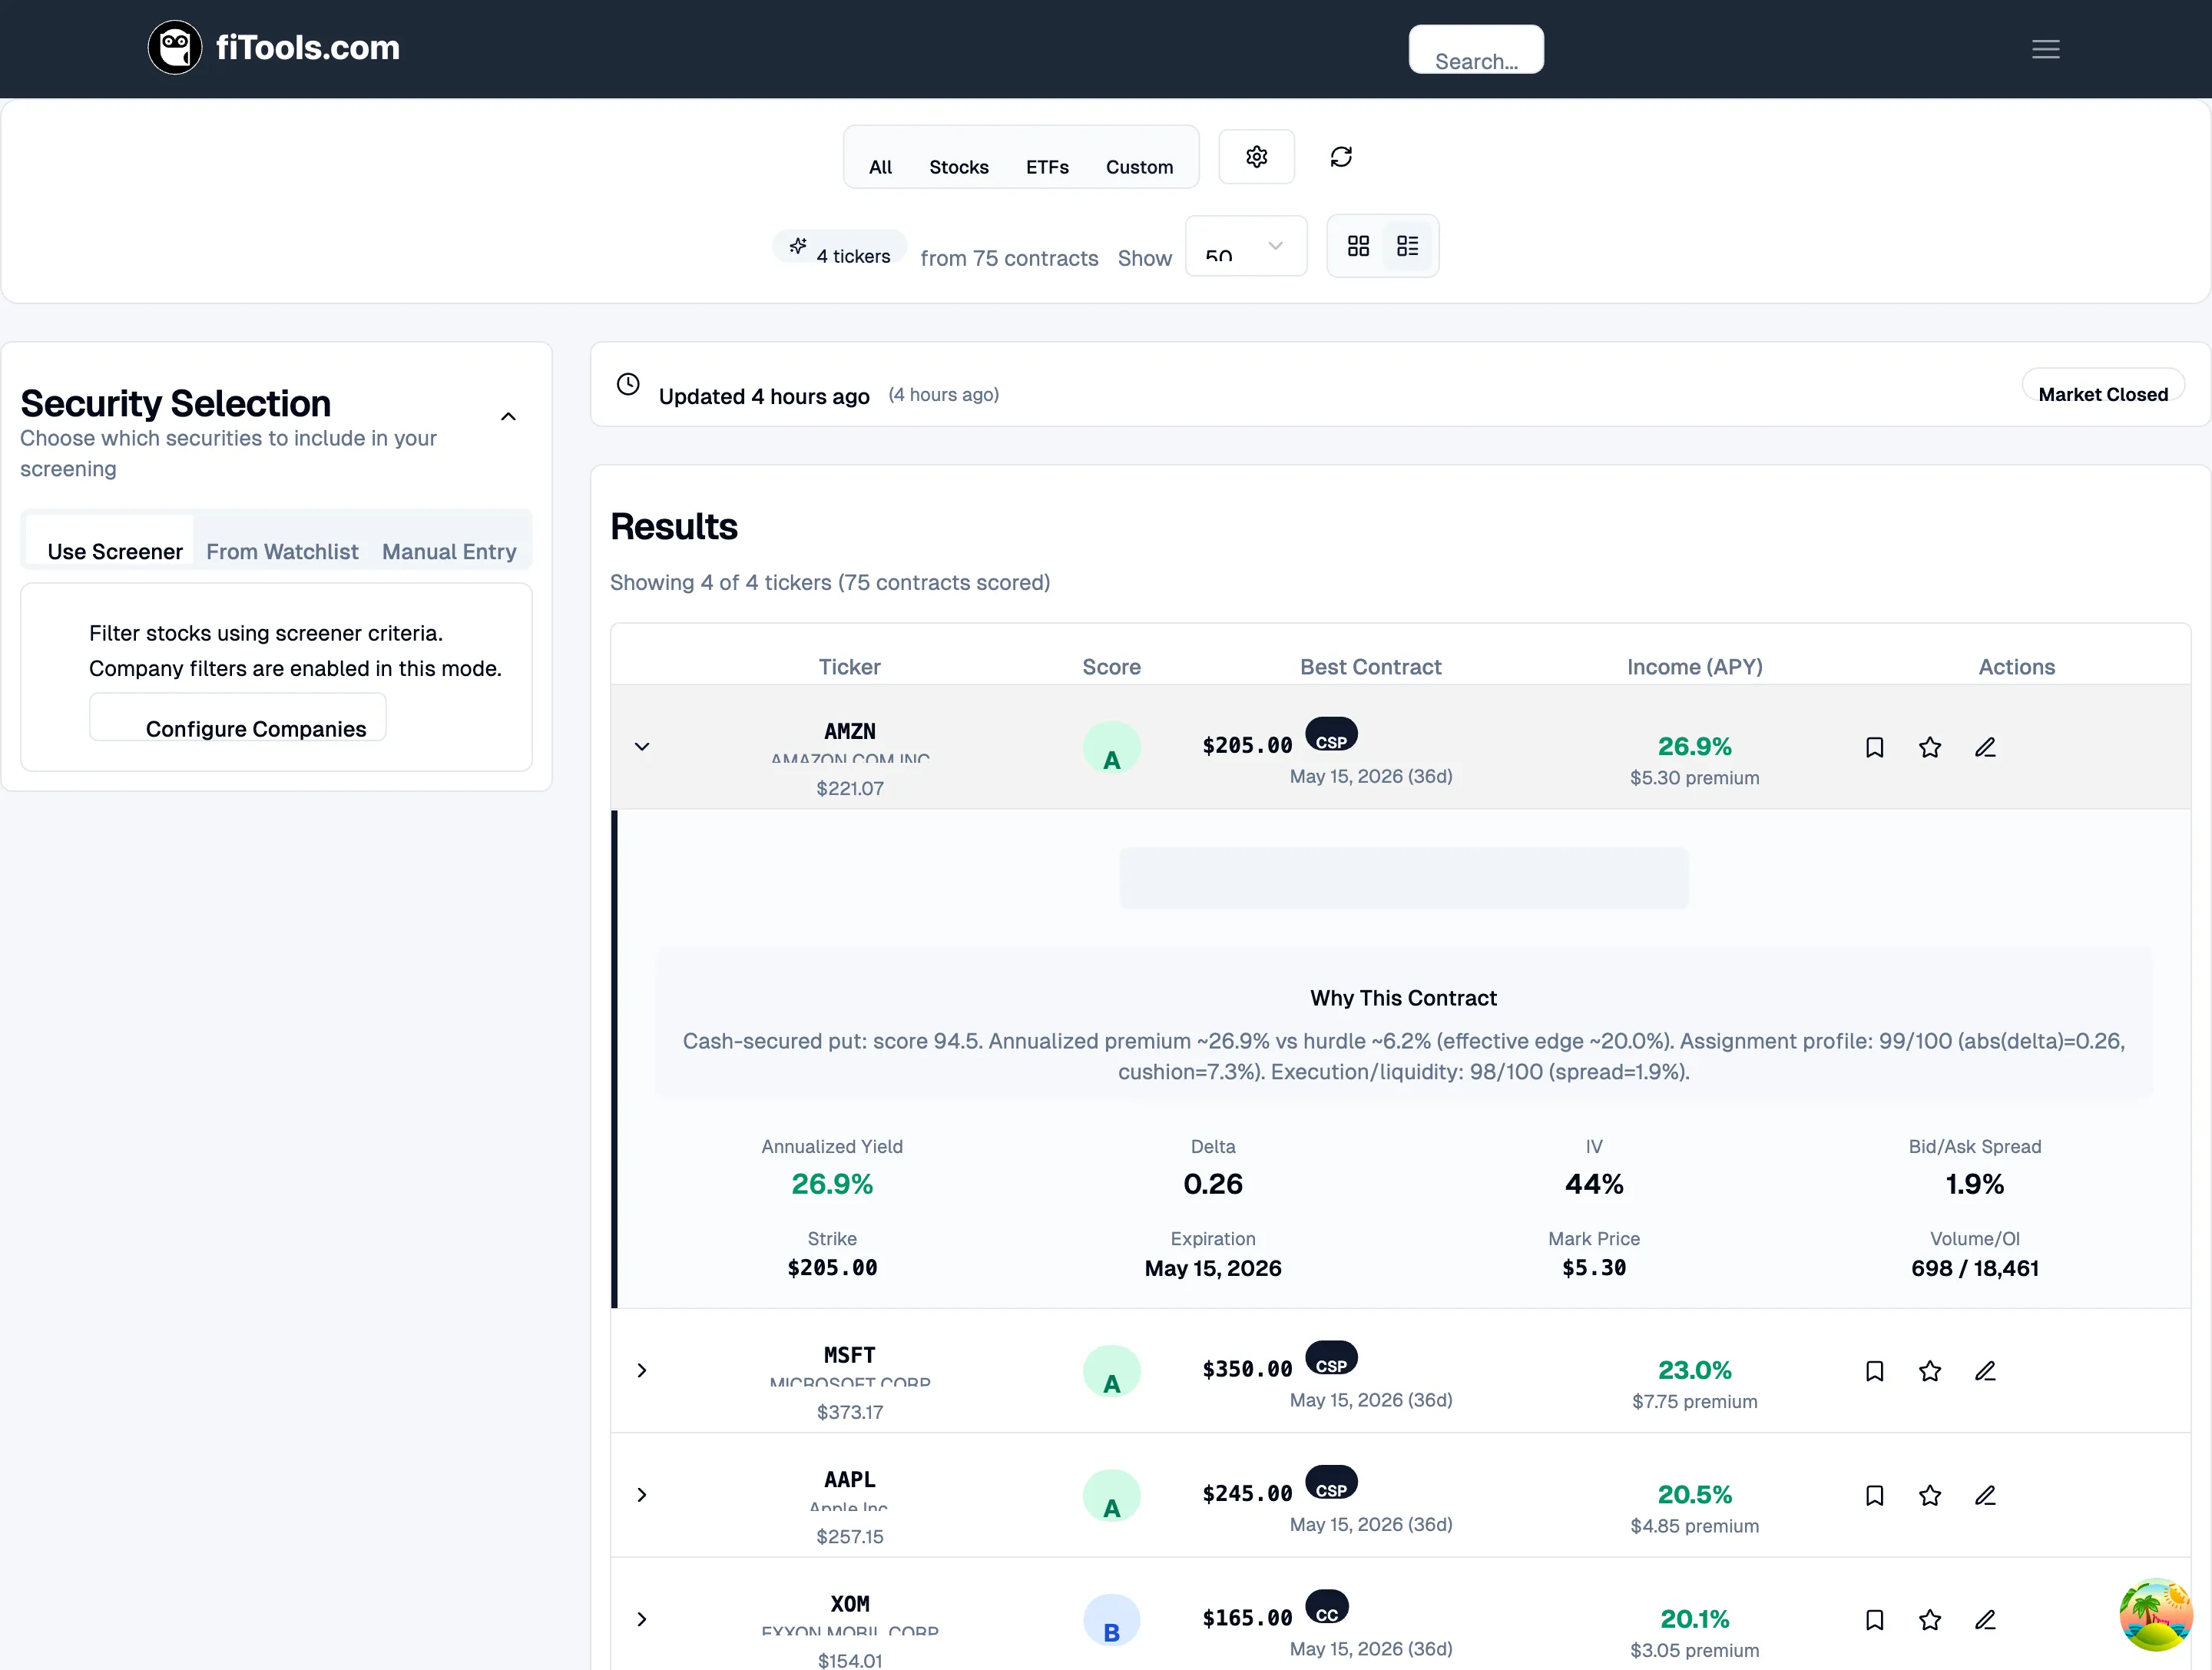
Section titled “Controls bar”The controls bar at the top of the page lets you configure the screener’s scope and display without leaving the results view.

From left to right you will find:
- Security type selector — Choose All, Stocks, ETFs, or Custom to control which securities the screener evaluates. Selecting Custom opens the Security Selection sidebar.
- Filter Options — Opens the options filter sheet where you set strategy, timing, income, liquidity, and Greeks criteria.
- Refresh — Re-runs the screener with your current filters against the latest data.
- Results count — Shows how many tickers matched and how many contracts were scored.
- Page size — Choose 25, 50, or 100 results per page.
- View mode toggle — Switch between card view (beginner-friendly) and table view (compact).
Selecting securities
Section titled “Selecting securities”When you choose Custom in the controls bar, a Security Selection sidebar appears on the left side of the page. It gives you three ways to choose which tickers to screen.
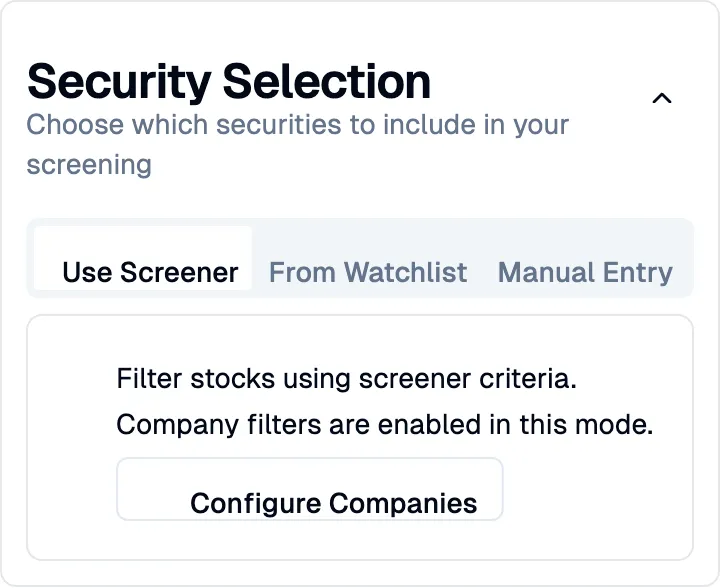
Use Screener
Section titled “Use Screener”This is the default mode. The screener evaluates all securities that pass your company filters. You can click Configure Companies to adjust sector, market cap, and other fundamental criteria.
From Watchlist
Section titled “From Watchlist”Switch to the From Watchlist tab to screen only the tickers you have saved to your watchlist. This is useful when you already have a set of companies you follow and want to check for new options opportunities. Company filters are disabled in this mode since you have already hand-picked your tickers.
Manual Entry
Section titled “Manual Entry”The Manual Entry tab lets you type in specific ticker symbols separated by commas or spaces. You can add up to 100 tickers. Your manual list is saved automatically so it persists between sessions.
Card view
Section titled “Card view”Card view is the default display mode. Each card represents one ticker and shows the top-scoring contract for that ticker.
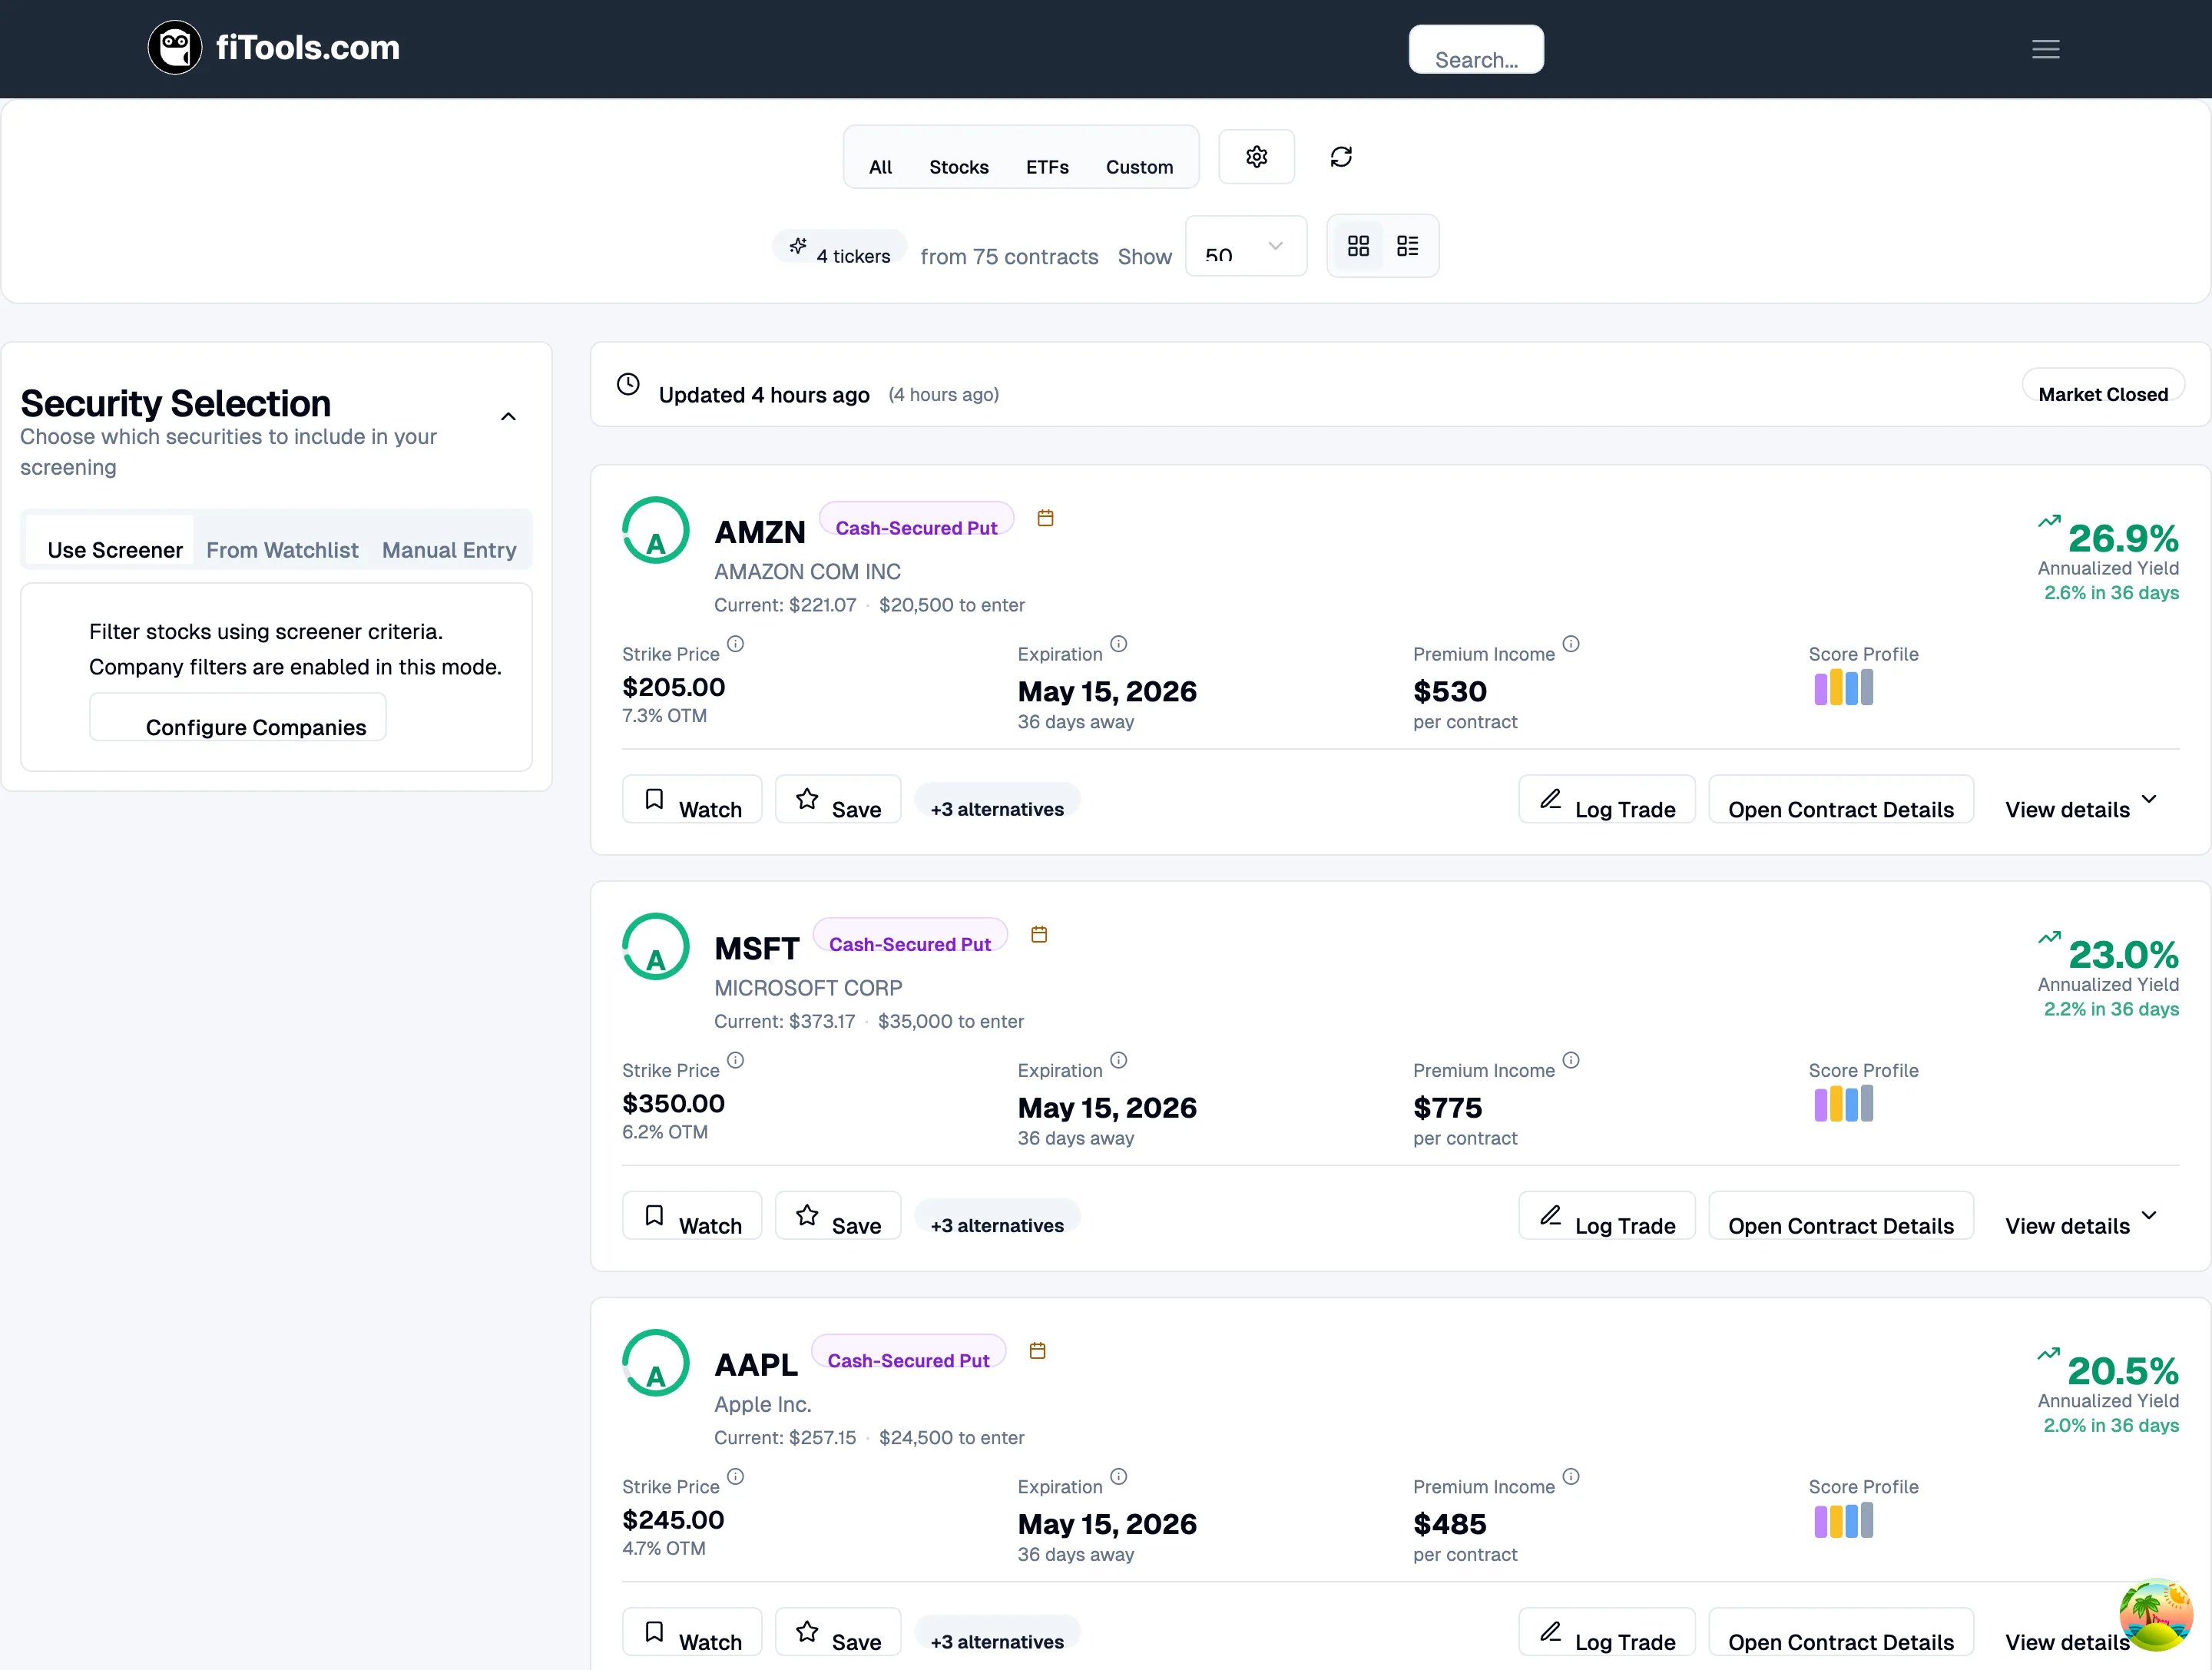
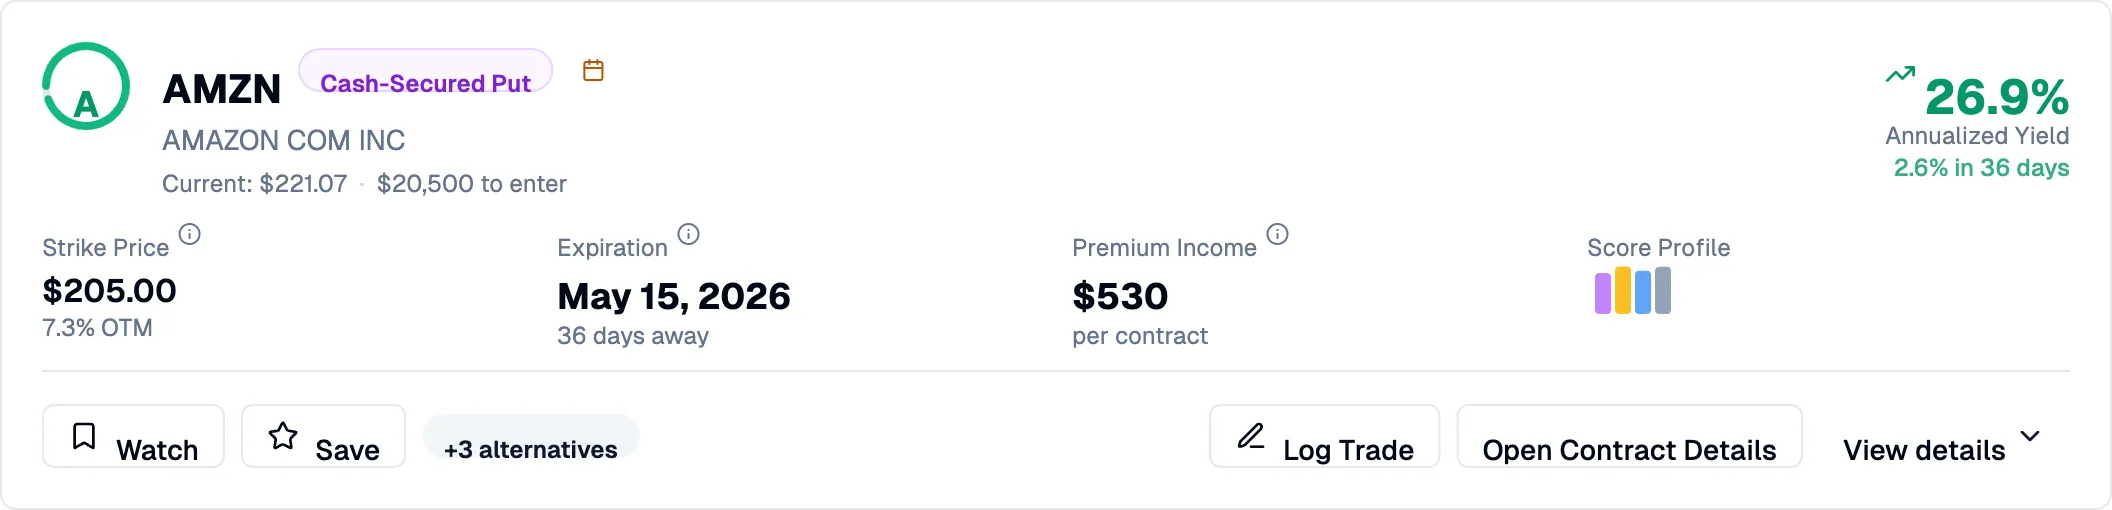
Each result card includes:
- Score indicator — A circular badge with a letter grade (A through F) and numeric score out of 100.
- Strategy badge — Labeled either “Covered Call” or “Cash-Secured Put” depending on the contract type.
- Warning icons — Appear when the contract has a wide bid-ask spread, minimal edge over the hurdle rate, unfavorable volatility, or earnings before expiration.
- Key metrics — Strike price with distance from spot, expiration date with days remaining, premium income per contract, and a mini score-profile bar chart.
- Annualized yield — The headline return figure, displayed prominently on the right.
- Action bar — Buttons to watch the ticker, save the contract, log a trade, open contract details, or expand the card.
Expanded card
Section titled “Expanded card”Click View details on any card to reveal the score breakdown, contract details, capital requirements, and alternative contracts.
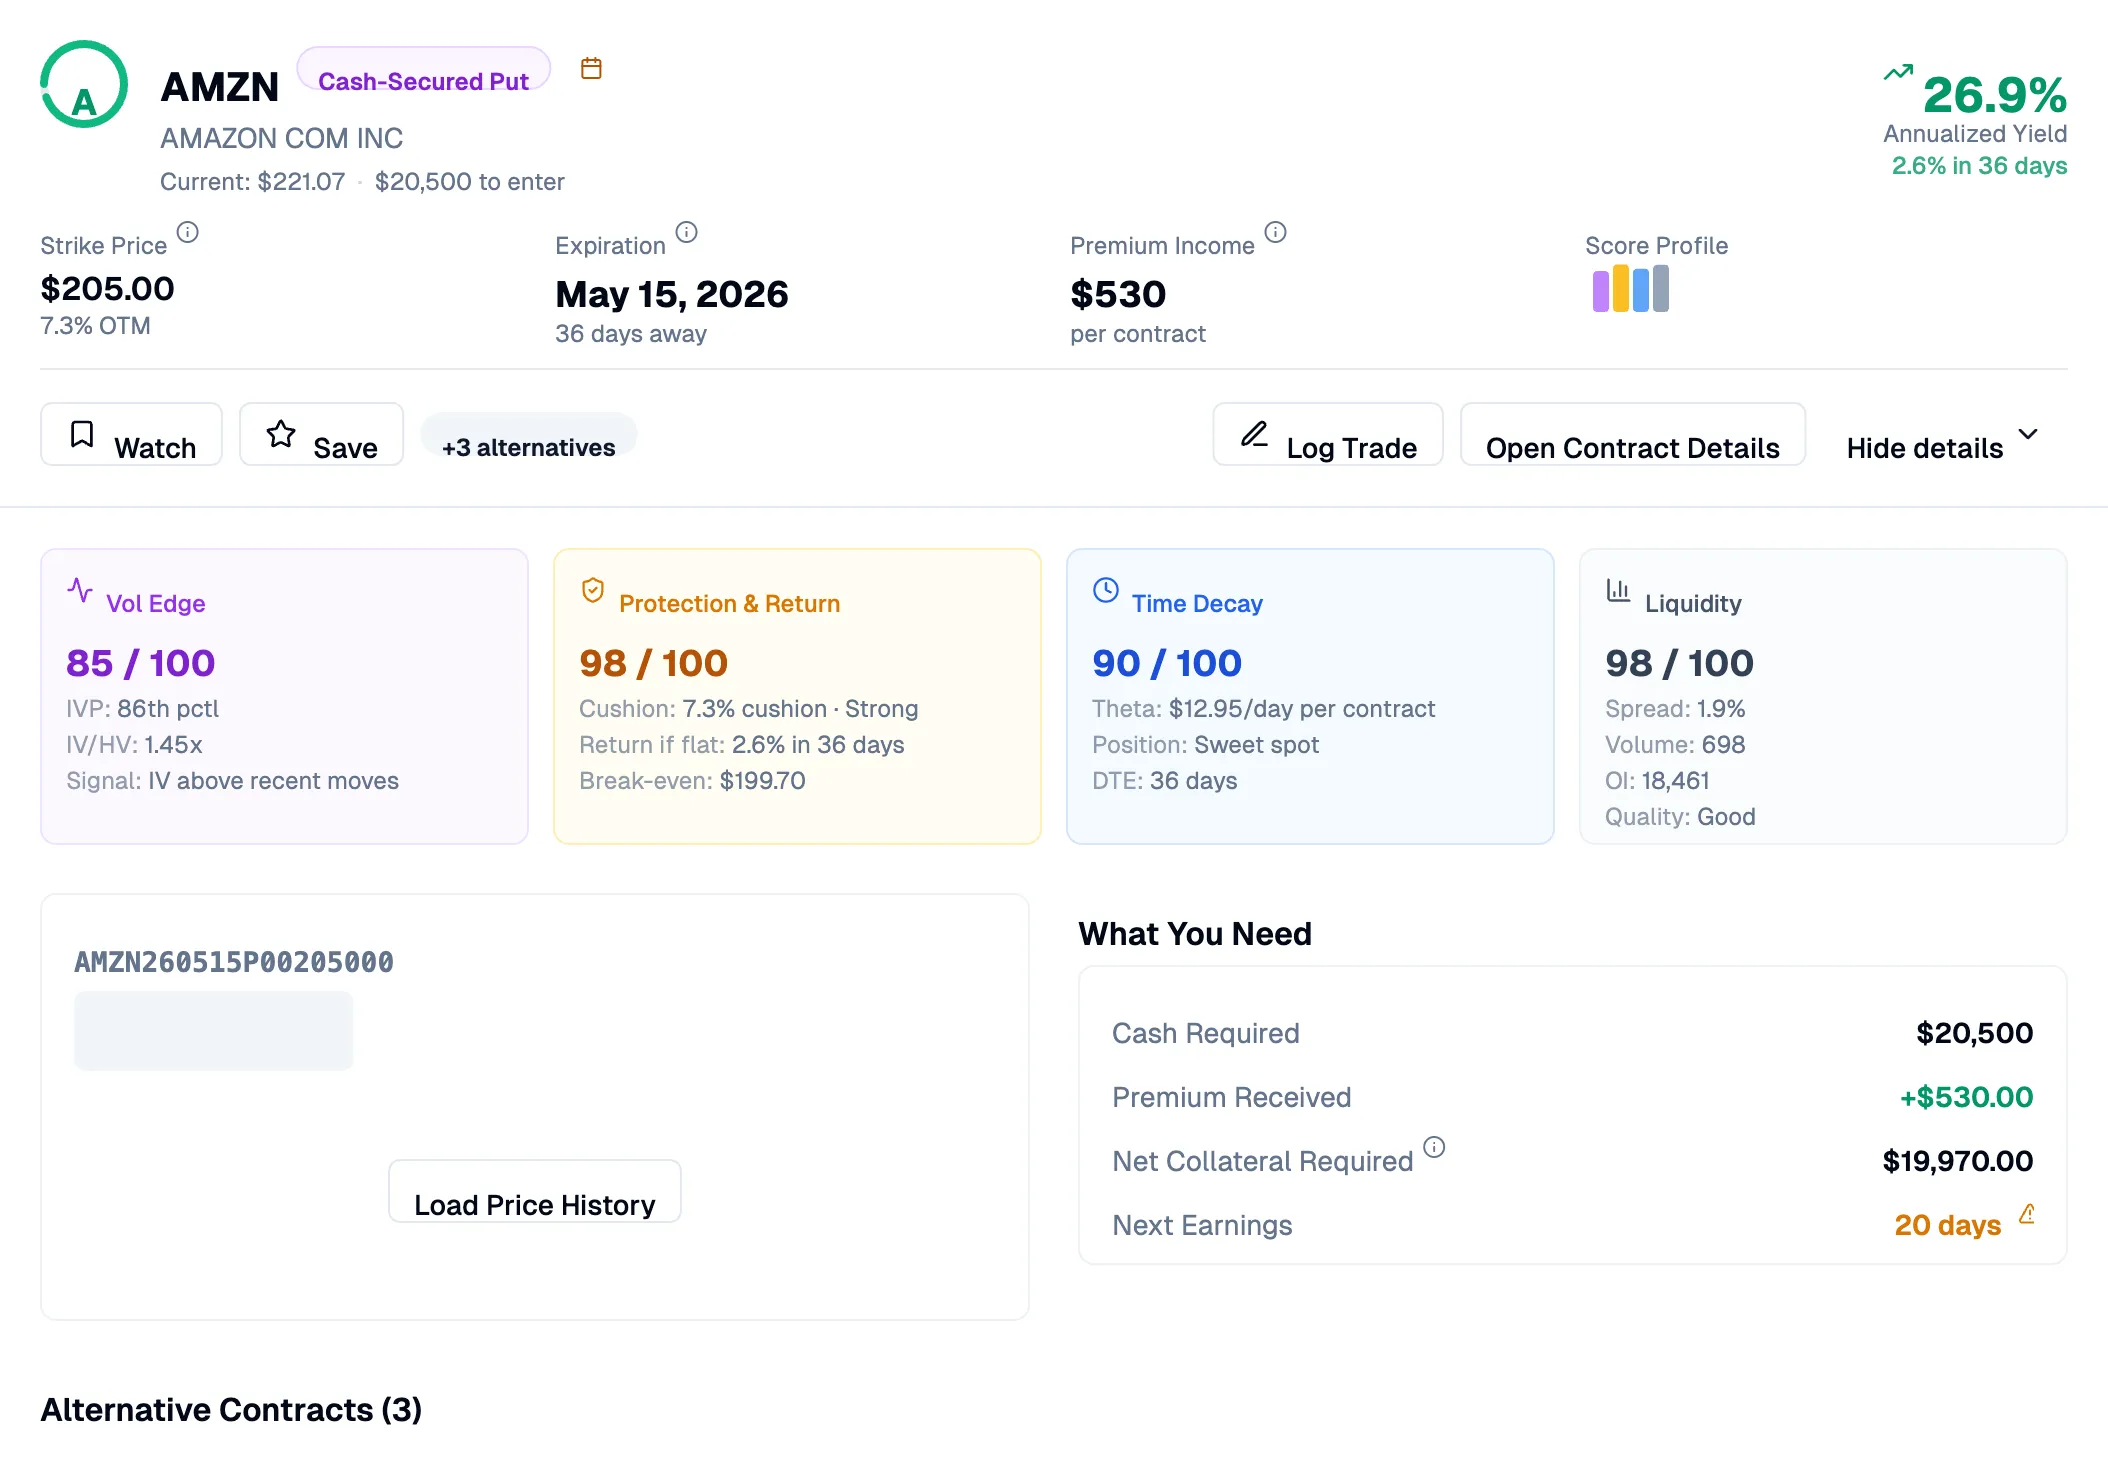
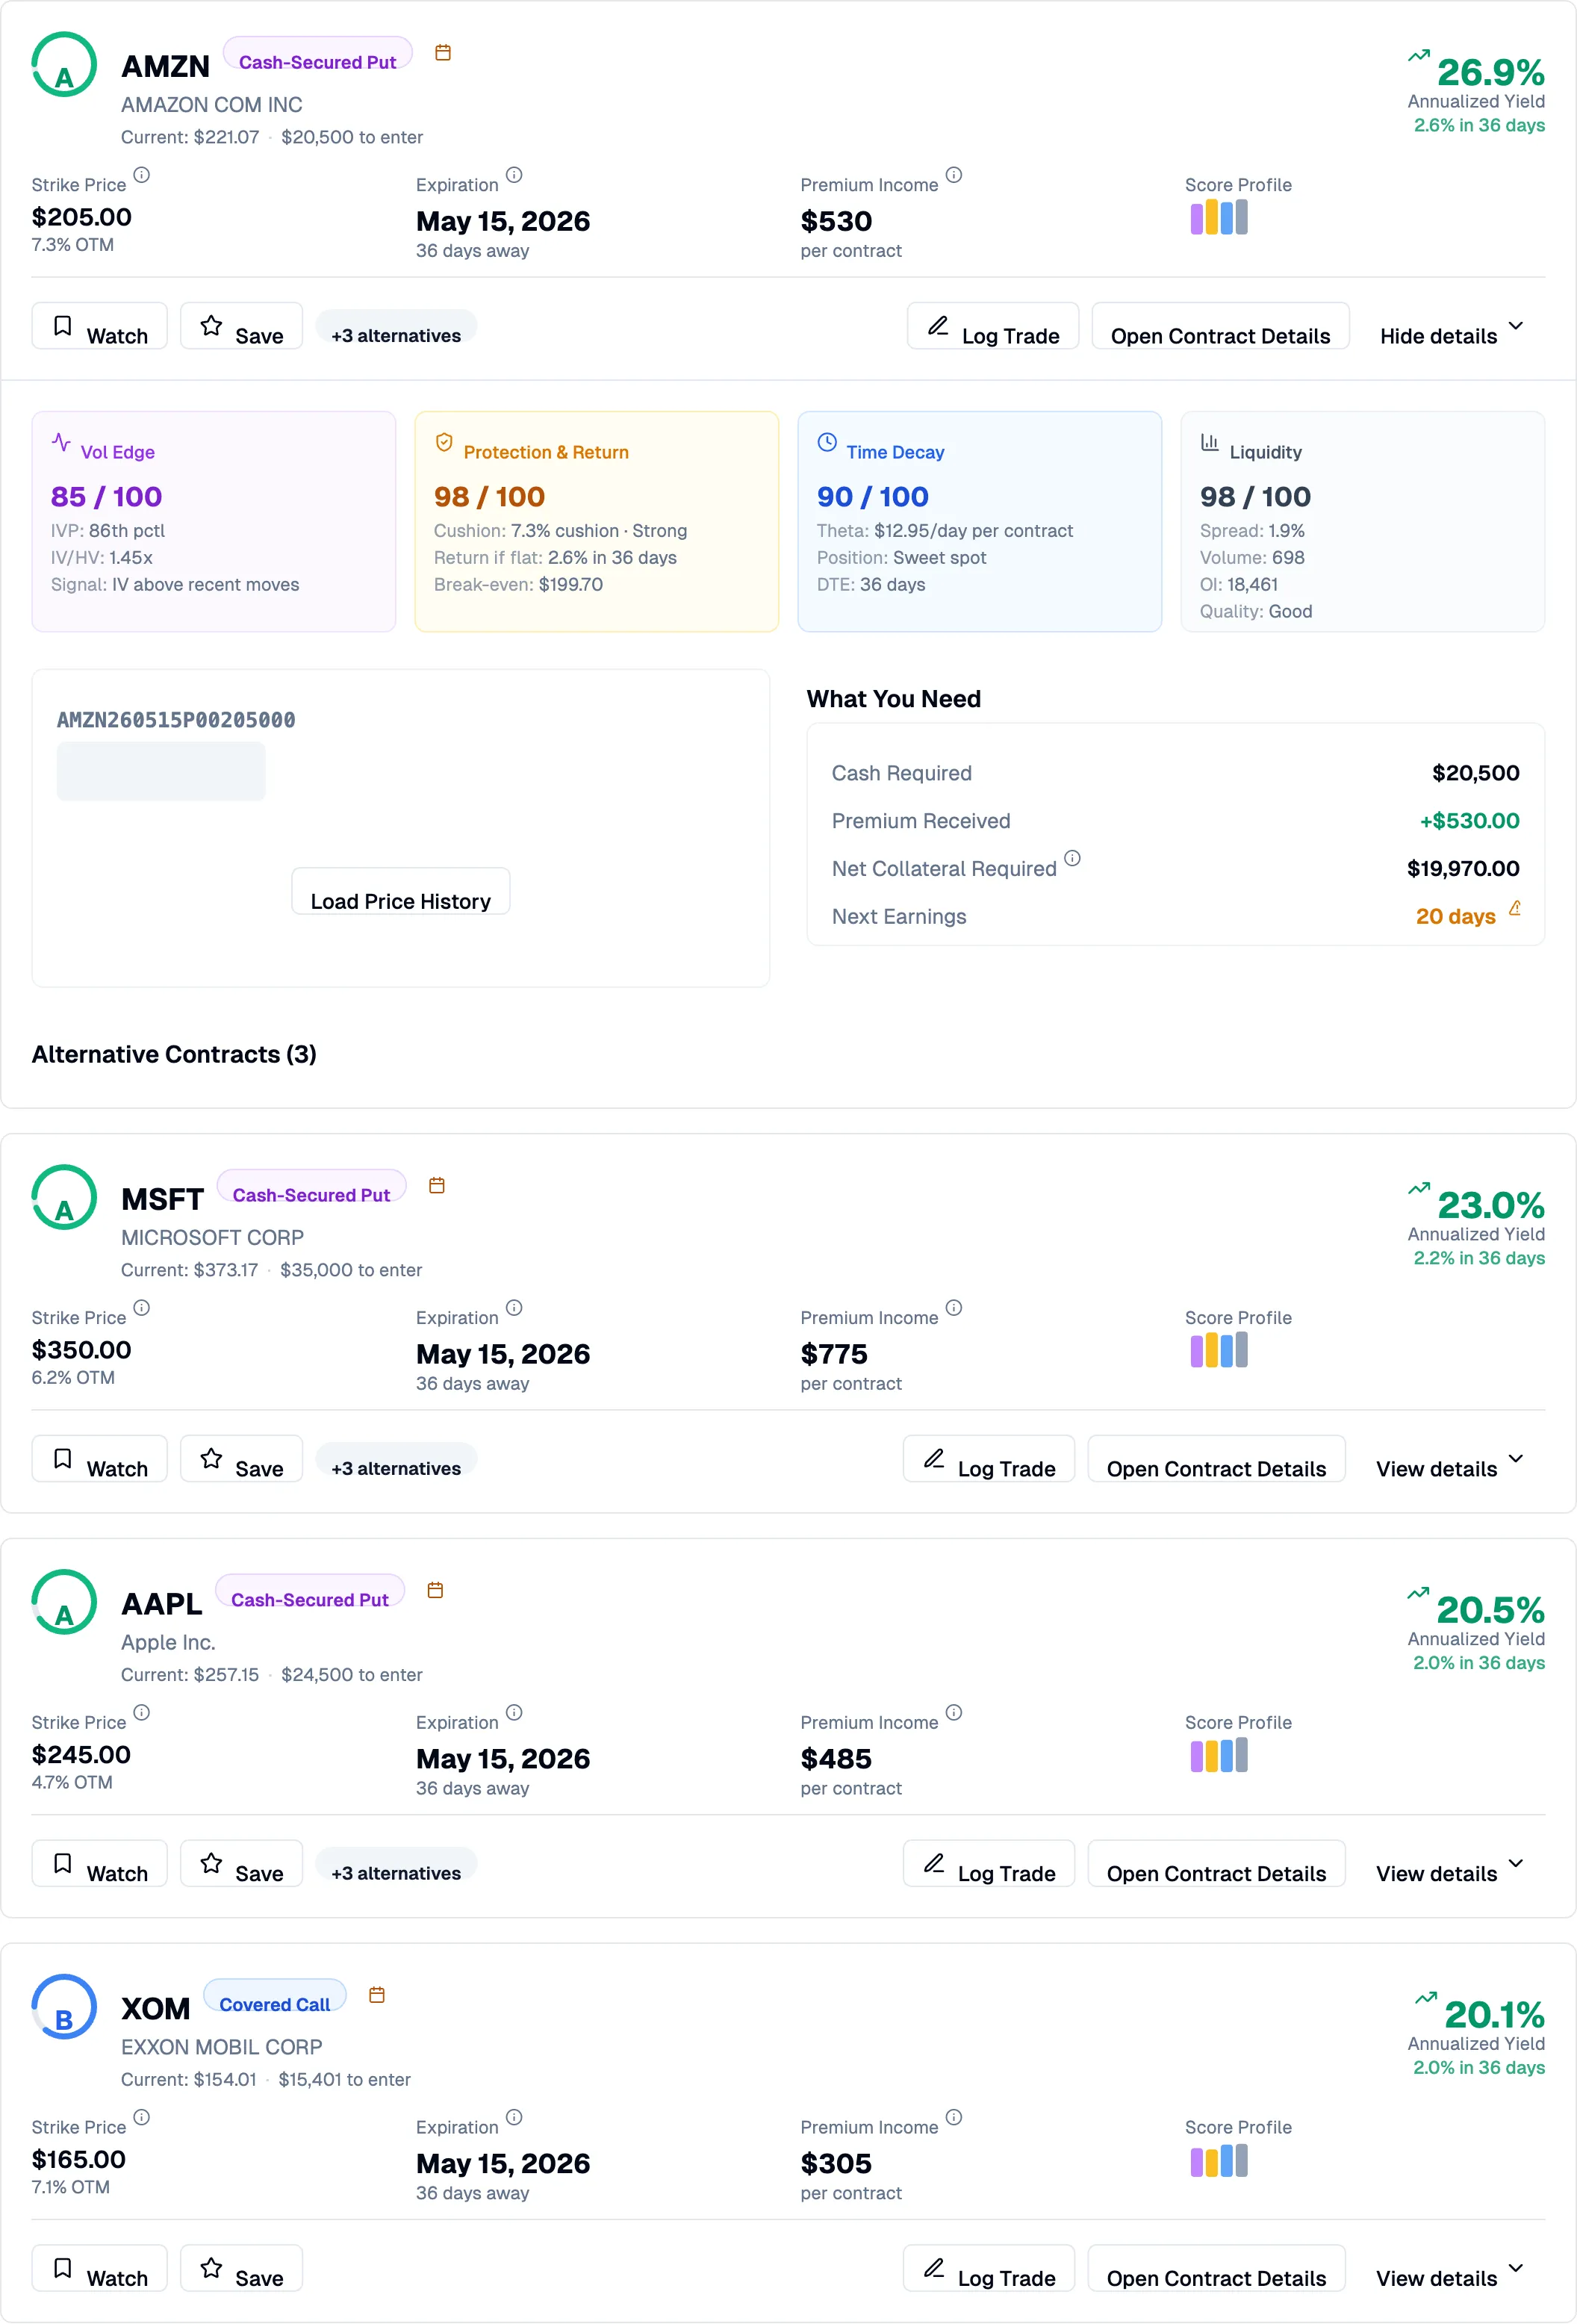
The expanded view adds:
- Score explainer panels — Four color-coded panels for Vol Edge (purple), Protection & Return (amber), Time Decay (blue), and Liquidity (slate). Each shows a score out of 100 with supporting details.
- What You Need — A summary of the capital required, premium received, net collateral, and days until next earnings.
- Alternative contracts — Other strike/expiration combinations for the same ticker that also scored well. Up to six alternatives are shown with their score, strike, expiration, yield, protection cushion, theta decay, and liquidity.
Table view
Section titled “Table view”Table view shows the same data in a compact, sortable format. Switch to it using the list icon in the controls bar.
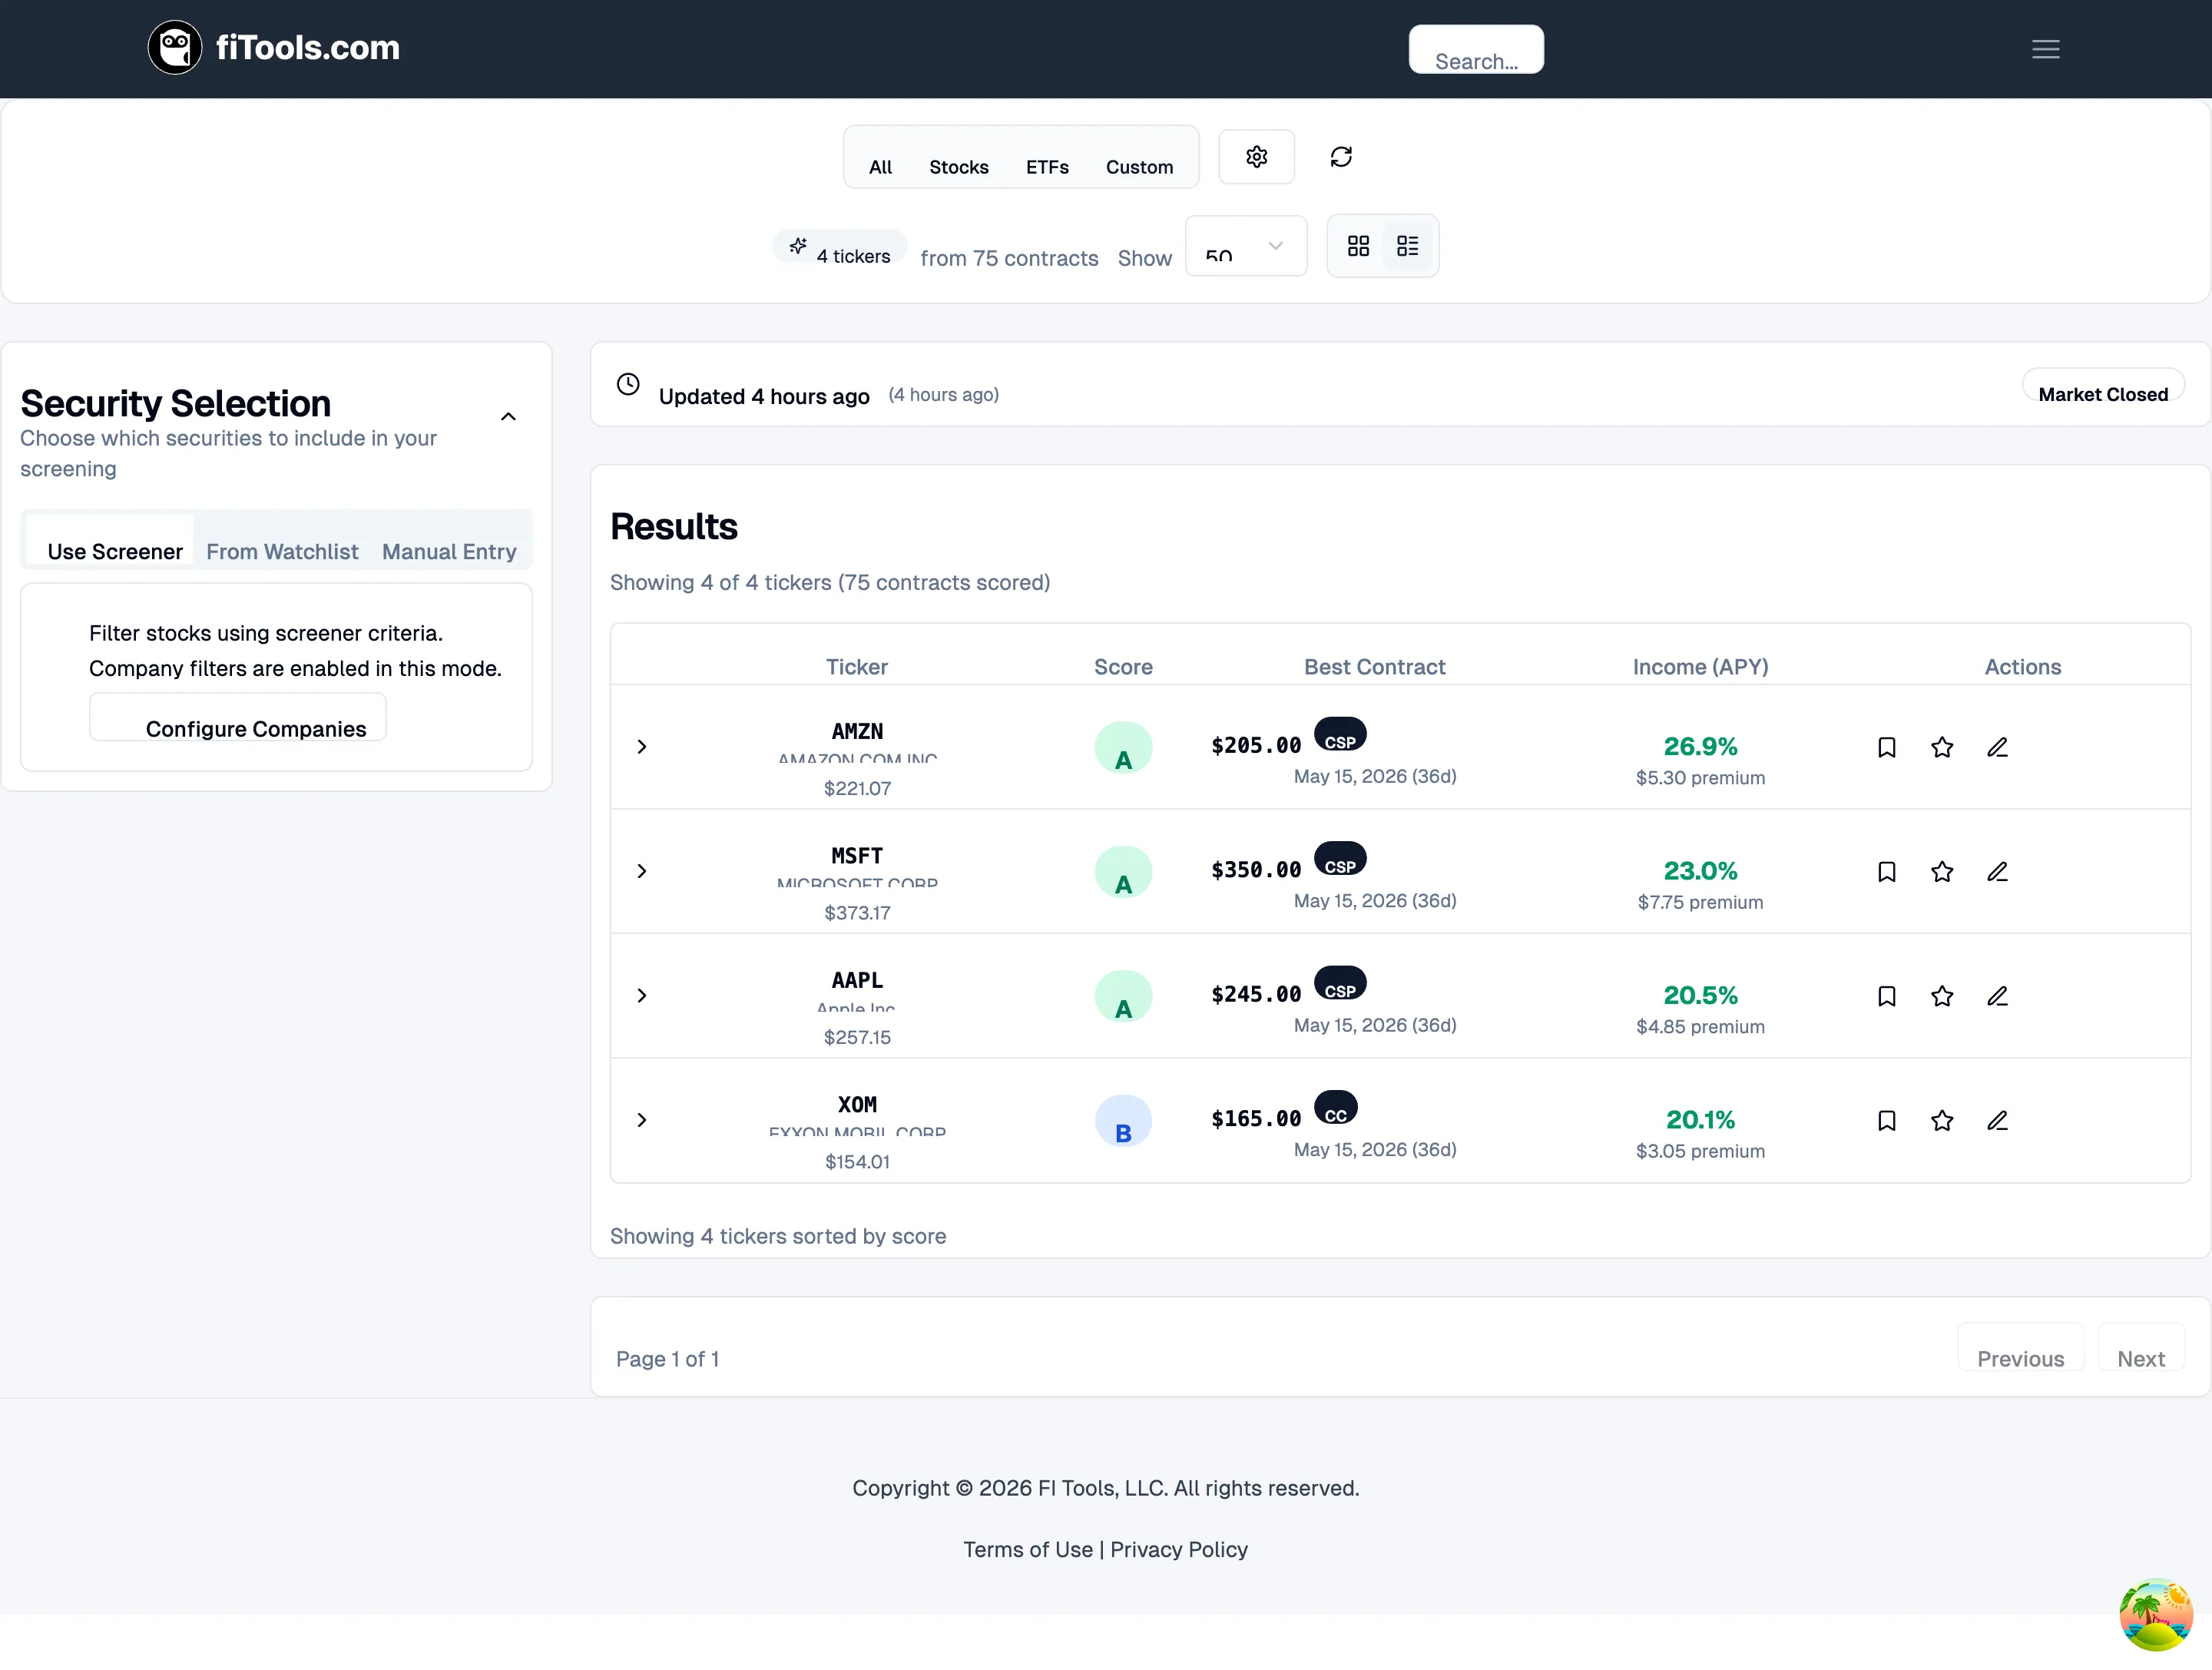
Each row displays the ticker, score tier badge, best contract (strike, type, expiration), annualized yield with premium, risk profile with delta and flags, and action icons for watchlist, save, and trade logging.
Expanded table row
Section titled “Expanded table row”Click any row to expand it. The expanded section has three tabs.
- Selected Contract — Shows the rationale text explaining why this contract scored well, along with detailed metrics (annualized yield, delta, IV, bid-ask spread, strike, expiration, mark price, and volume/OI).
- Alternatives — Lists other qualifying contracts for the same ticker with score badges, strike, expiration, yield, and delta.
- Ticker Info — Company name, sector, security type, current price, strike-vs-spot distance, and days to earnings.
Understanding scores
Section titled “Understanding scores”Every contract receives a composite score from 0 to 100, bucketed into tiers that give you a quick read on quality.
| Tier | Range | Meaning |
|---|---|---|
| A | 80-100 | Excellent — strong yield with a solid safety buffer |
| B | 60-79 | Good — solid balance of yield and risk |
| C | 40-59 | Fair — acceptable with some trade-offs |
| D | 20-39 | Marginal — below-average opportunity |
| F | 0-19 | Poor — significant concerns identified |
The score is built from four component dimensions:
- Vol Edge — Evaluates whether implied volatility is rich relative to historical volatility. A high IV/HV ratio means you are collecting premium above what realized moves would justify.
- Protection & Return — Combines the cushion (how far the strike sits from the current price) with the period return. More cushion and higher return both push this score up.
- Time Decay — Measures whether the contract sits in the “sweet spot” of the theta decay curve (typically 25-45 DTE) where daily decay accelerates in your favor.
- Liquidity — Assesses bid-ask spread, daily volume, and open interest. Tight spreads and deep markets mean you can enter and exit at fair prices.
Warning flags
Section titled “Warning flags”Contracts may carry one or more warning flags that indicate risk factors:
- Wide Spread — The bid-ask spread is unusually wide, which increases execution cost.
- Thin Edge — The premium barely exceeds the hurdle rate, leaving little margin for error.
- Weak Vol Setup — Implied volatility is low relative to recent history, reducing the premium you collect.
- Short DTE — The contract expires very soon, limiting time for the trade to work.
- Earnings before expiration — The company reports earnings before the contract expires, which can cause large price swings.
Filtering options
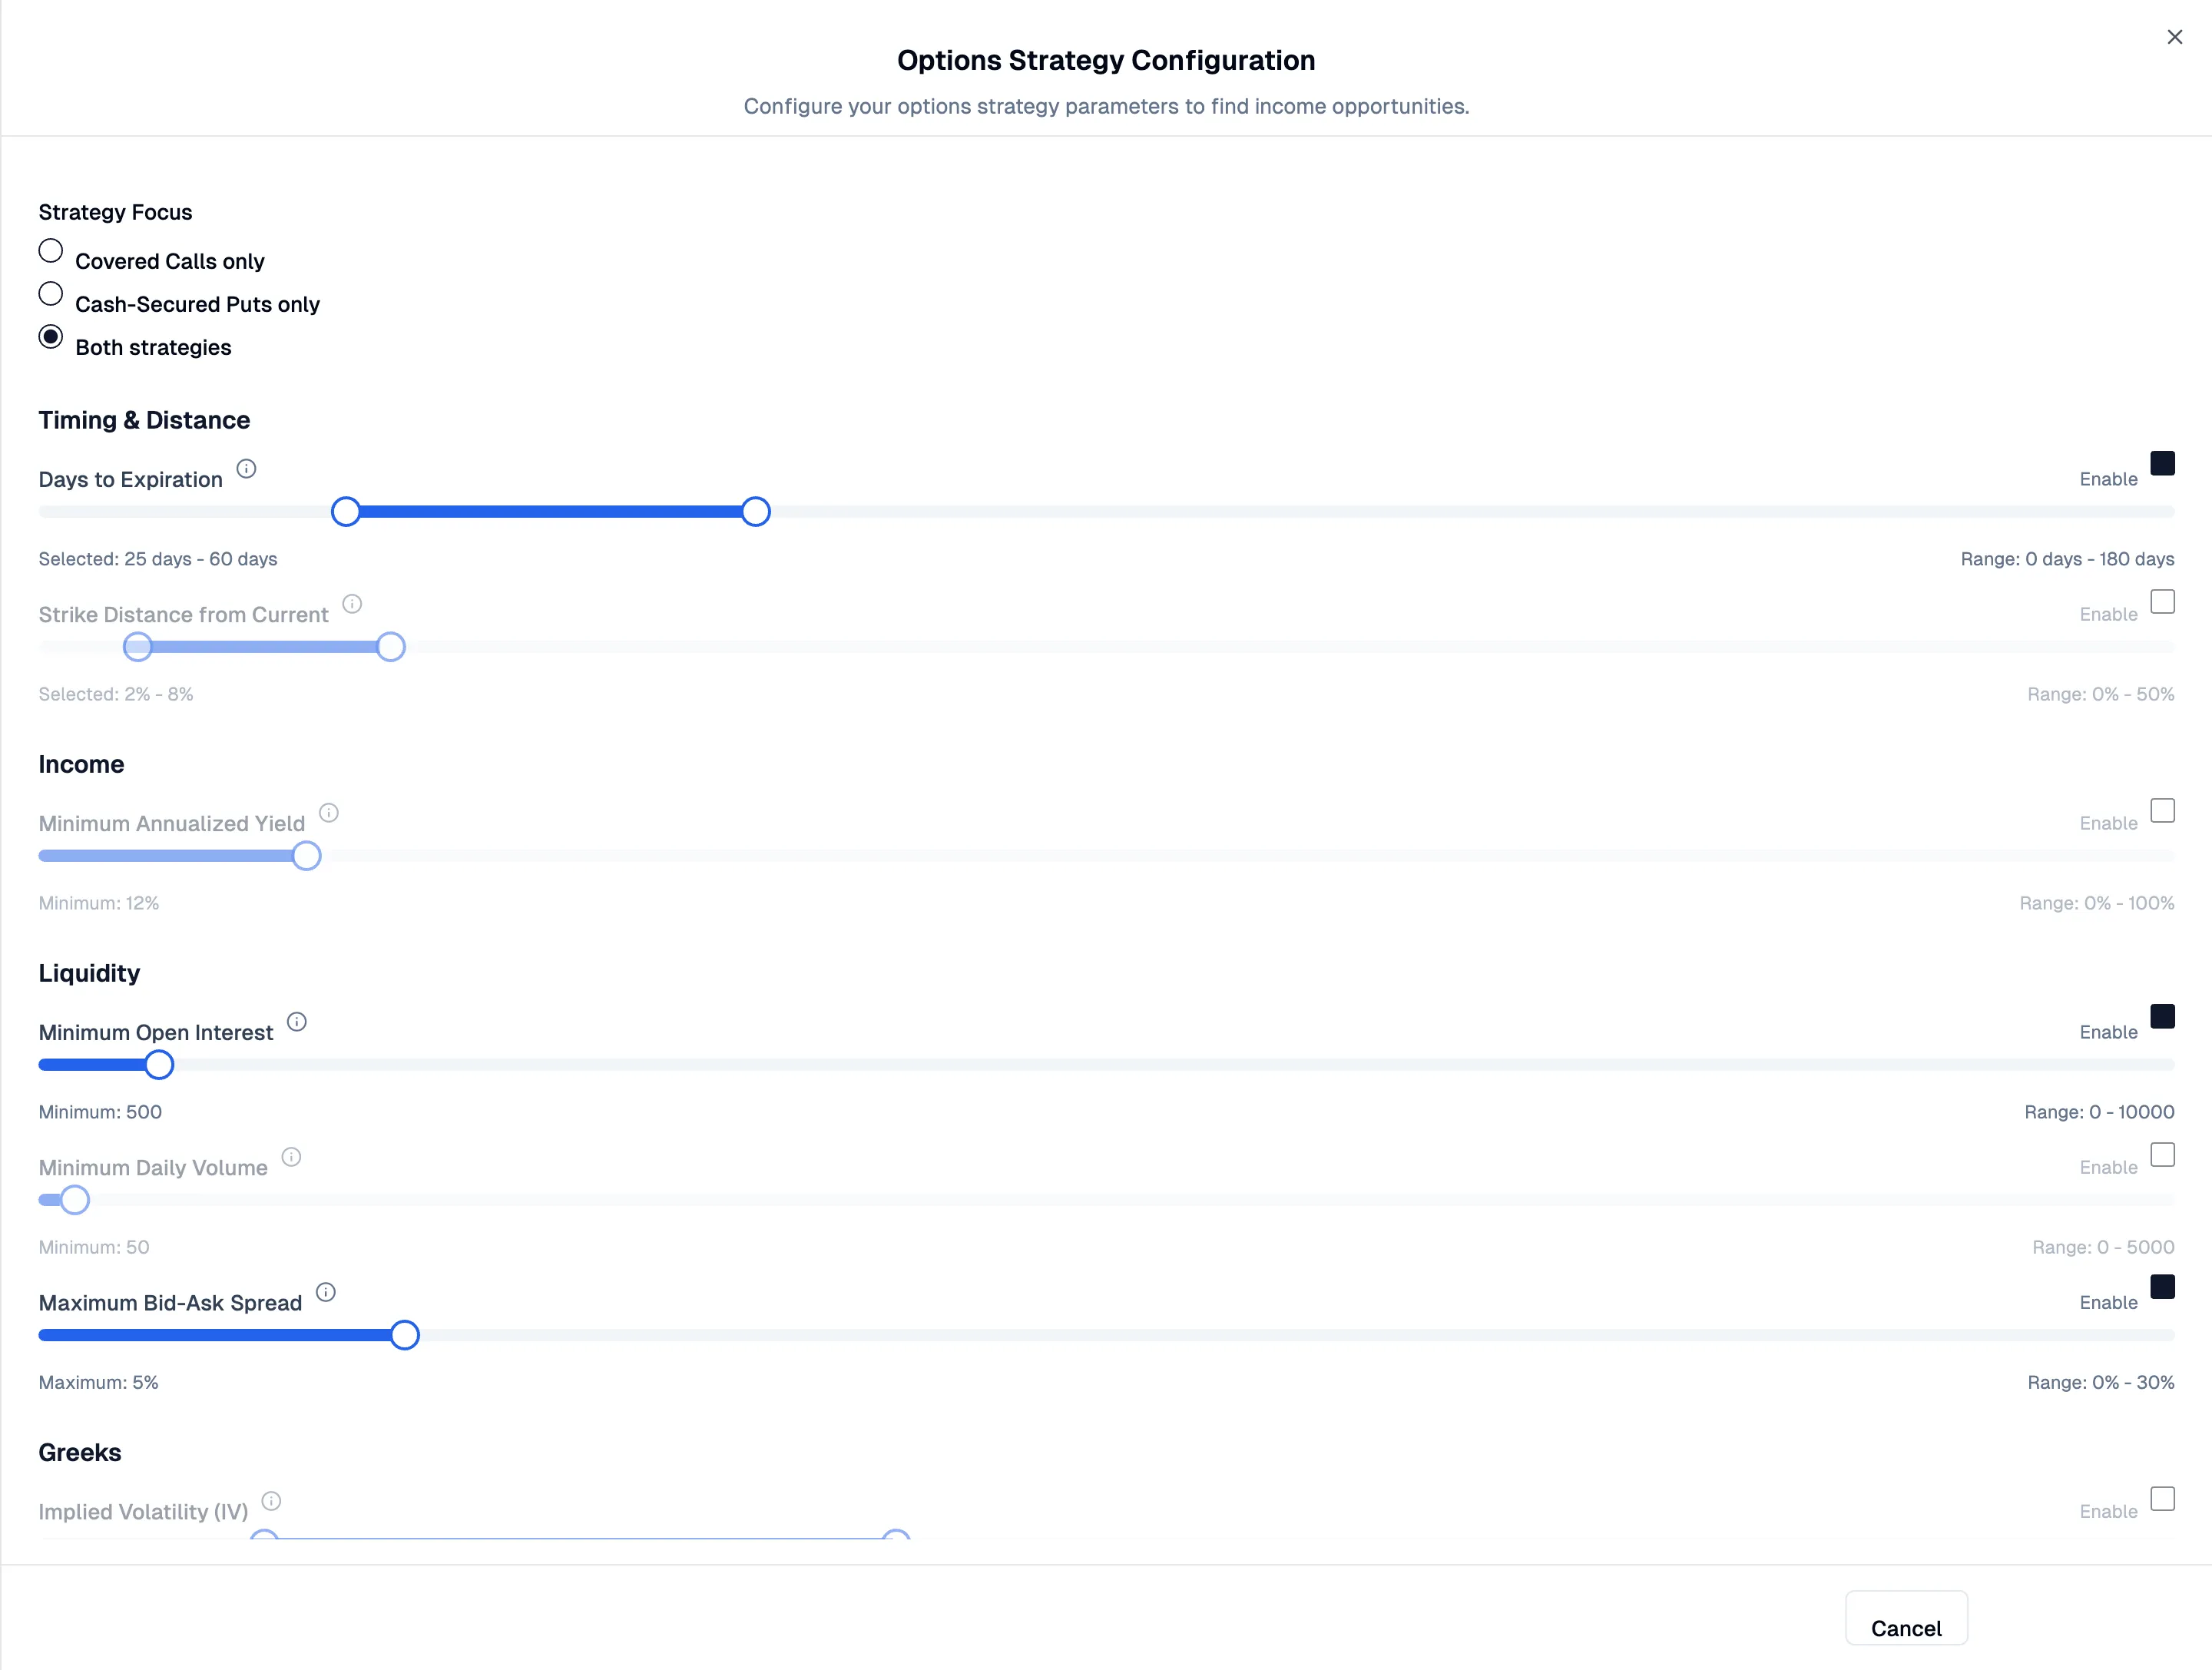
Section titled “Filtering options”Click Filter Options in the controls bar to open the Options Strategy Configuration sheet. Filters use slider controls with enable/disable toggles so you can activate only the criteria you care about.
Strategy Focus
Section titled “Strategy Focus”Choose whether to screen for Covered Calls only, Cash-Secured Puts only, or Both strategies.
Timing & Distance
Section titled “Timing & Distance”- Days to Expiration — Set a minimum and maximum DTE range. A common starting point is 25-60 days.
- Strike Distance from Current — How far the strike should sit from the current stock price, expressed as a percentage.
Income
Section titled “Income”- Minimum Annualized Yield — Set a floor for the annualized return. Contracts below this threshold are excluded.
Liquidity
Section titled “Liquidity”- Minimum Open Interest — Filters out thinly traded contracts.
- Minimum Daily Volume — Ensures enough daily activity for fair execution.
- Maximum Bid-Ask Spread — Caps how wide the spread can be, as a percentage.
Greeks
Section titled “Greeks”- Implied Volatility (IV) — Set a range to target contracts in a specific volatility band.
- Delta — Filter by absolute delta to control assignment probability.
- Theta — Filter by daily time decay.
- Gamma — Filter by rate of delta change.
Other Filters
Section titled “Other Filters”- Moneyness — Include or exclude in-the-money (ITM) and out-of-the-money (OTM) contracts.
- Exclude earnings — Remove contracts where the company reports earnings before expiration.
Logging trades
Section titled “Logging trades”When you find a contract you want to act on, click Log Trade on the result card or table row. This opens the trade logging dialog pre-filled with the contract details.
The dialog is pre-configured for a Sell to Open action (since the screener surfaces premium-selling strategies). It fills in the ticker, option code, strike, expiration, option type, and mark price so you only need to confirm the quantity and your actual fill price.
After logging, the trade appears in your portfolio’s active positions where you can track it through expiration or closure.
Data freshness
Section titled “Data freshness”A banner at the top of the results area shows when the options data was last updated, how many hours old it is, and whether the market is currently open or closed.
During weekends and market holidays, the banner indicates that prices are from the last trading session. During extended market closures the screener displays a dedicated message and pauses scoring until fresh data is available.