Dashboard
The dashboard is your home base in FITools. It combines portfolio status, income tracking, market context, and learning resources into a single view so you can assess your positions and take action without navigating between pages.
Getting an overview of your dashboard
Section titled “Getting an overview of your dashboard”When you first open FITools, you land on the dashboard at /dashboard. The layout adapts based on whether you have active positions.
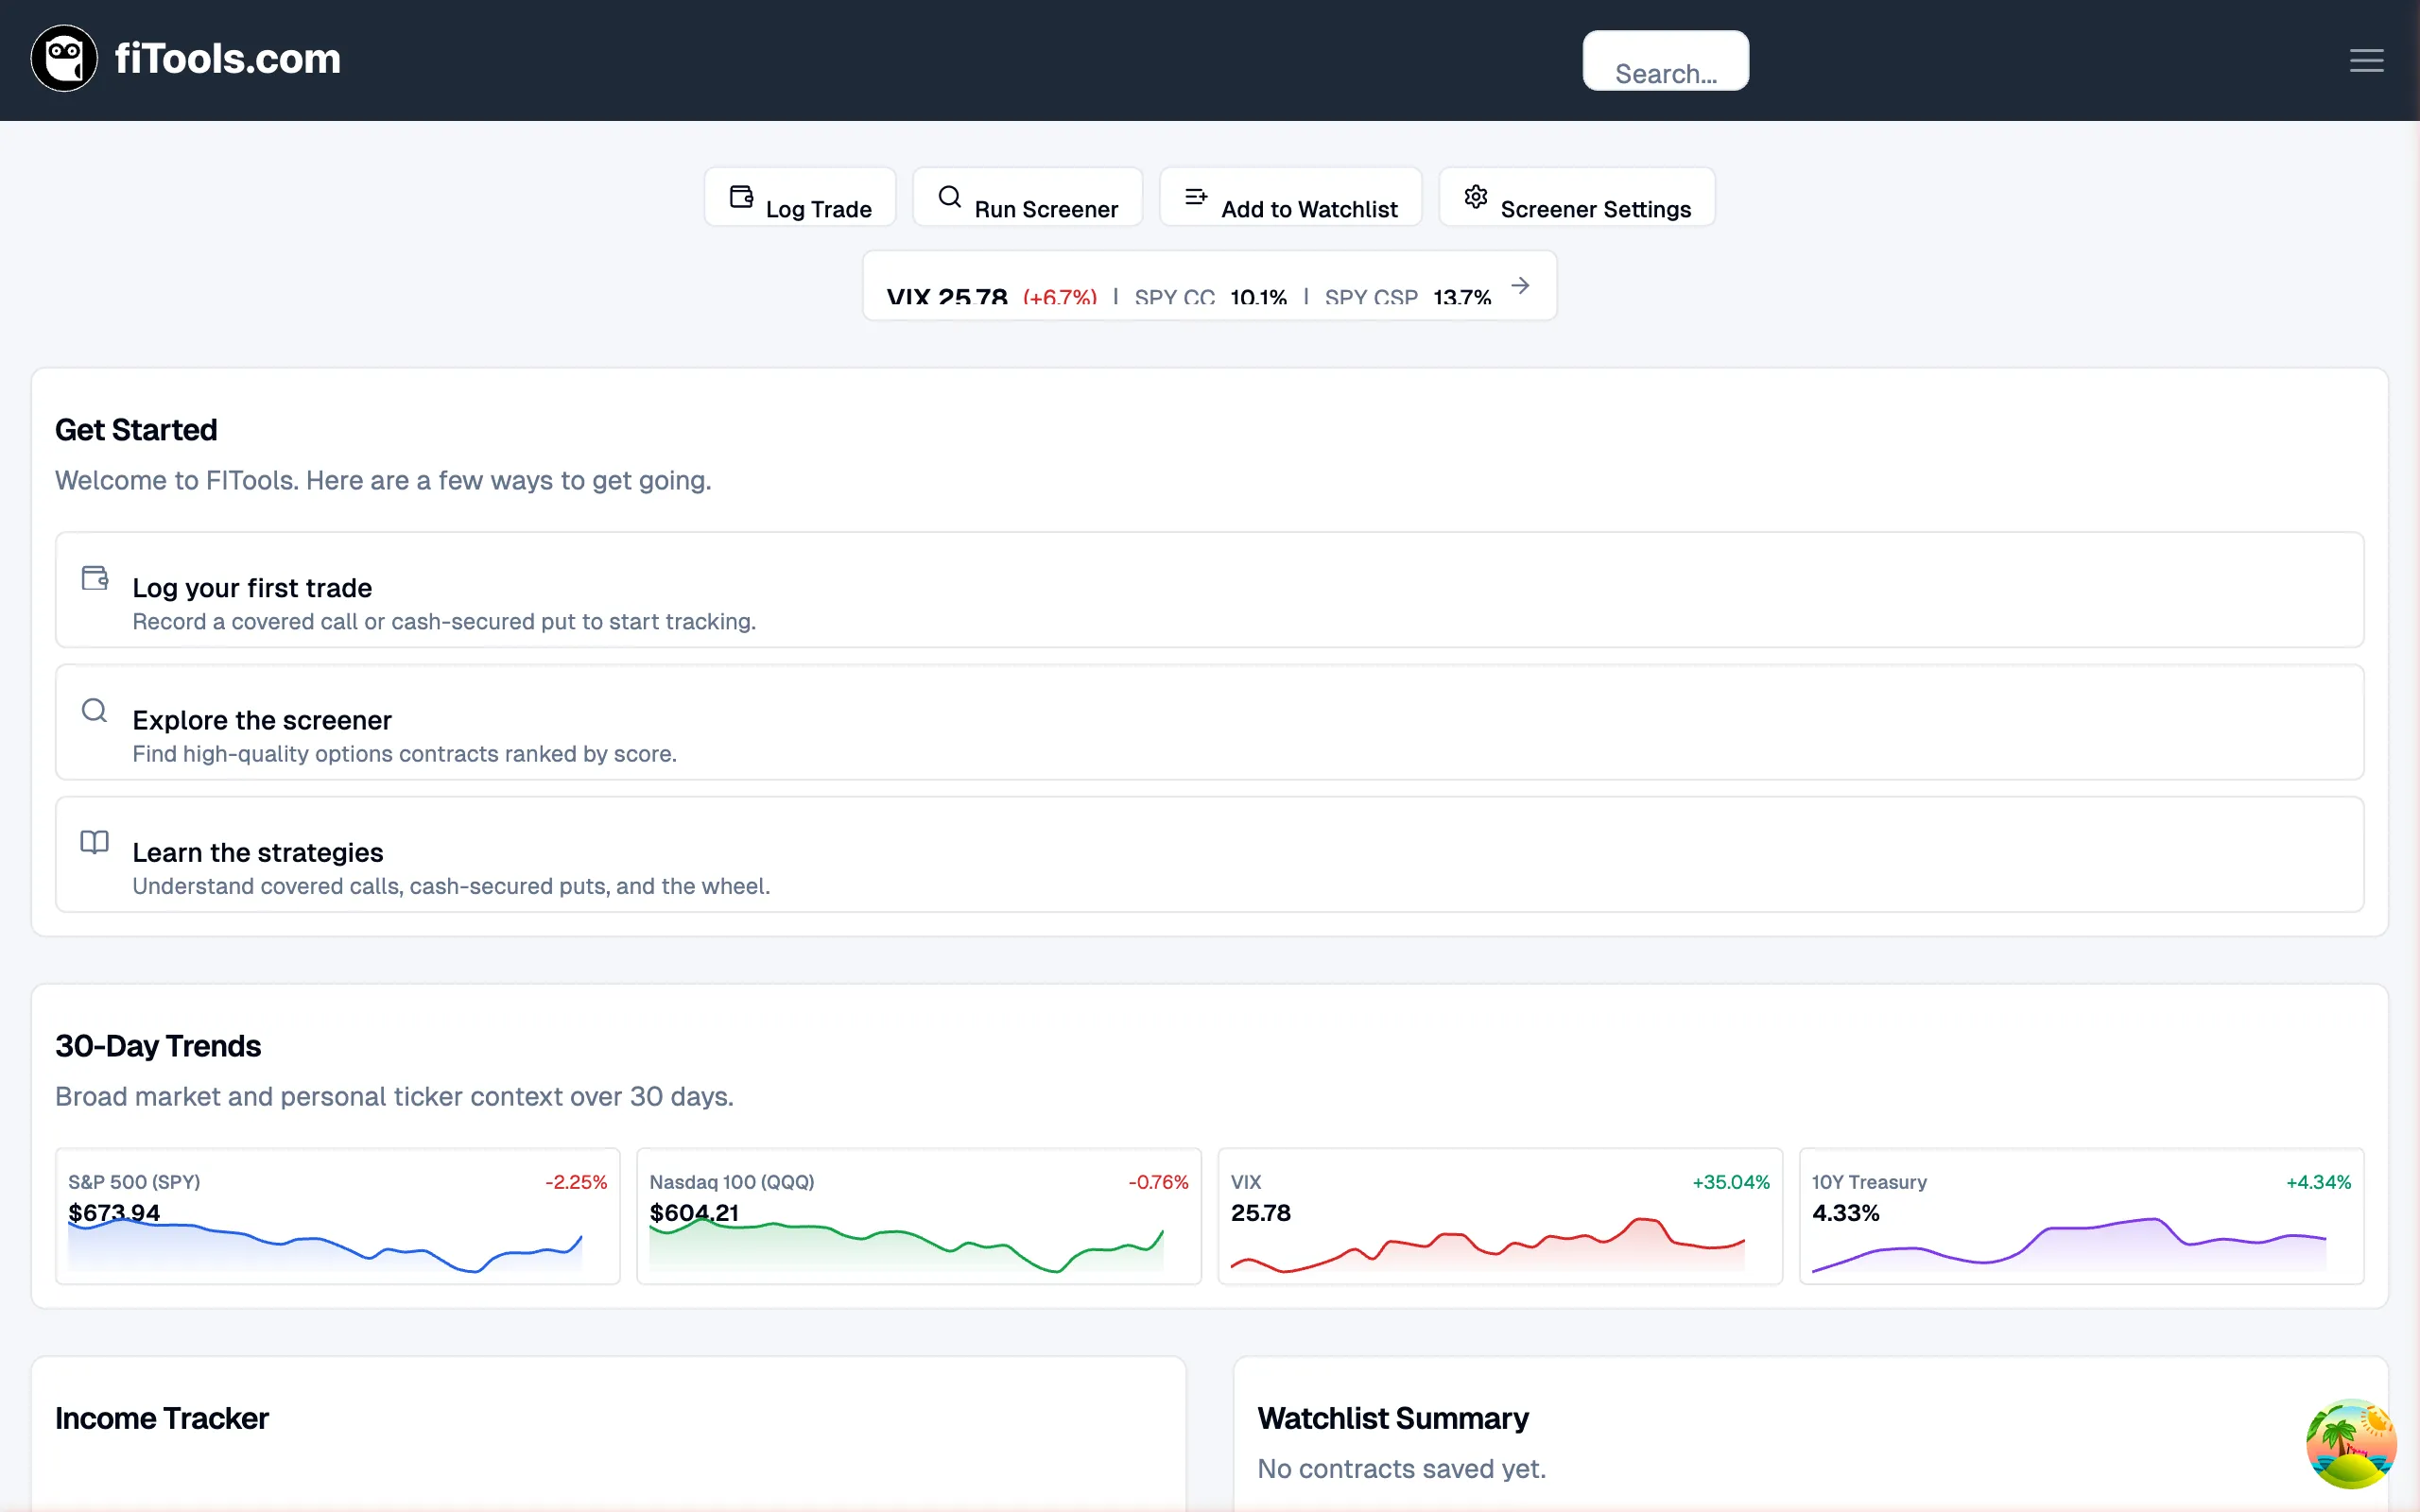
If you have no positions yet, you will see onboarding waypoints that guide you through logging your first trade, exploring the screener, and learning the supported strategies. Once you add a position, the onboarding section is replaced by the Active Positions card.
Taking quick actions
Section titled “Taking quick actions”The Quick Actions Bar runs across the top of the dashboard. It gives you one-click access to the tasks you perform most often:
- Log Trade — open the income page with the trade form ready to go
- Run Screener — jump to the options screener to find new opportunities
- Add to Watchlist — navigate to the screener to save contracts for monitoring
- Screener Settings — configure your default screener filters and strategy preferences
To the right of the quick actions you will see the Market Strip. It displays the current VIX level with its daily change, plus SPY covered call and cash-secured put yields. Click the strip to open the full Seller’s Climate page.
Monitoring your active positions
Section titled “Monitoring your active positions”Once you have open trades, the Active Positions card becomes the hero section of the dashboard. It is designed to surface the positions that need your attention first.
Summary stats
Section titled “Summary stats”Five stat tiles across the top of the card show your portfolio at a glance:
- YTD Income — total premium collected this year
- Avg Monthly — average monthly income based on year-to-date data
- Premium in Play — unrealized premium on open positions
- Capital Deployed — total capital committed to your positions
- Ann. Yield — annualized return from premium income relative to capital deployed
Scatter plot
Section titled “Scatter plot”Below the stats, a scatter plot maps each position by days to expiration (x-axis, decreasing left to right) and premium captured percentage (y-axis). Dots are colored green for profitable positions and red for underwater ones, with dot size proportional to the return if unchanged.
Two configurable threshold lines divide the chart into attention zones:
- Profit target (horizontal dashed line) — positions above this line have captured enough premium to consider closing
- Expiration window (vertical dashed line) — positions to the right of this line are approaching expiration
Positions that cross both thresholds appear in a red-tinted zone. Positions crossing one threshold appear in a yellow-tinted zone. Click any dot to open its position detail.
Position rows
Section titled “Position rows”Each position is listed below the scatter plot as a clickable row showing the ticker, strategy type (CC or CSP), strike price, and expiration date. On desktop, each row also displays:
- Captured — a gauge showing how much premium you have captured, with a marker at your profit target
- DTE — days to expiration with color coding (green for 21+ days, amber for 10-20, red for under 10)
- Prob. ITM — approximate probability of the option finishing in the money
- Return — the dollar return if the underlying price stays unchanged
Positions are sorted by urgency. Rows triggering both rules (profit target reached and inside expiration window) appear first with a red left border. Rows triggering one rule get an amber border.
Customizing display rules
Section titled “Customizing display rules”Click the gear icon in the top-right corner of the Active Positions card to adjust the two threshold rules:
- Profit target — the premium captured percentage at which a position is flagged (default: 50%)
- Expiration window — the number of days to expiration at which a position is flagged (default: 15 days)
Your settings are saved in your browser and persist across sessions. Click “Reset to defaults” to restore the original values.
Discovering new opportunities
Section titled “Discovering new opportunities”The Opportunities card appears directly below the Active Positions card. It shows the top three option contracts that match your current screener settings, ranked by the FITools score.
Each opportunity row displays the ticker, strategy type badge, strike price, expiration date, annualized yield, and score tier (A through F). Click a row to open the full contract detail page.
If no contracts match your settings, the card will suggest adjusting your screener filters. Click “Find more trades” at the bottom to open the full screener.
Tracking your premium income
Section titled “Tracking your premium income”The Income Tracker card summarizes your year-to-date premium performance and helps you stay on pace toward a monthly goal.
Setting a monthly goal
Section titled “Setting a monthly goal”If you have not set a goal yet, the card prompts you to create one. Click “Set goal” and enter a dollar amount. Once set, a progress bar shows how much of the current month’s goal you have reached, along with the number of days remaining.
To change or remove your goal, click the pencil icon in the card header. Enter a new amount and click “Save”, or click “Clear” to remove the goal entirely.
Monthly metrics
Section titled “Monthly metrics”Below the progress bar, two metric tiles show:
- Run Rate — your projected income for the full month based on what you have earned so far
- YTD Total — cumulative premium income for the calendar year
Click “View income details” at the bottom to open the full Income Dashboard where you can review individual trades, positions, and historical income.
Reviewing 30-day market trends
Section titled “Reviewing 30-day market trends”The 30-Day Trends card provides sparkline charts for key market indicators and your personal tickers over the trailing 30 days.
Four base symbols always appear:
- S&P 500 (SPY) — broad market direction
- Nasdaq 100 (QQQ) — tech-heavy index
- VIX — market volatility level
- 10Y Treasury (DGS10) — interest rate context
If you have open positions or watchlist contracts, those tickers automatically appear in a “Your Tickers” section below the base indicators. Each sparkline shows the current value, 30-day percentage change, and a mini chart. Click any ticker to open its detail page.
Watching your saved contracts
Section titled “Watching your saved contracts”The Watchlist Summary card shows the contracts you have saved from the screener. Each entry displays the ticker, strategy type, strike price, and expiration date.
Up to eight contracts are shown. Click any contract to open its detail page, or click “Open Full Watchlist” to see the complete list in the screener.
If your watchlist is empty, the card shows a demo contract and a link to add contracts from the screener.
Checking upcoming earnings
Section titled “Checking upcoming earnings”The Earnings Calendar appears as a horizontal strip of chips below the watchlist section. It shows upcoming earnings dates for companies where you hold positions.
Chips are color-coded:
- Amber — the earnings date falls before one of your position’s expiration dates, meaning the report could move the stock while your position is open
- Default — the earnings date is after all of your expirations for that ticker
Exploring educational resources
Section titled “Exploring educational resources”The Learn card at the bottom of the dashboard links to guides and strategies from the FITools Handbook. Content is organized into five sections: Options Foundations, Selling Strategies, Investing Fundamentals, FIRE & Retirement, and Platform Guides.
Click “Hide” to collapse the card if you no longer need it. Your preference is saved in your browser. Click “Show” to expand it again at any time.
Next steps
Section titled “Next steps”Now that you know your way around the dashboard:
- Log your first trade to populate the Active Positions card
- Run the screener to find covered call and cash-secured put opportunities
- Set up your account if you have not connected a brokerage yet