Platform Tour
FITools is built around a single goal: help you find, execute, and track income-generating options trades. This tour walks through each section of the platform so you know where everything lives.
Dashboard
Section titled “Dashboard”The dashboard is your home base. It combines quick actions, market context, and portfolio status into one view.
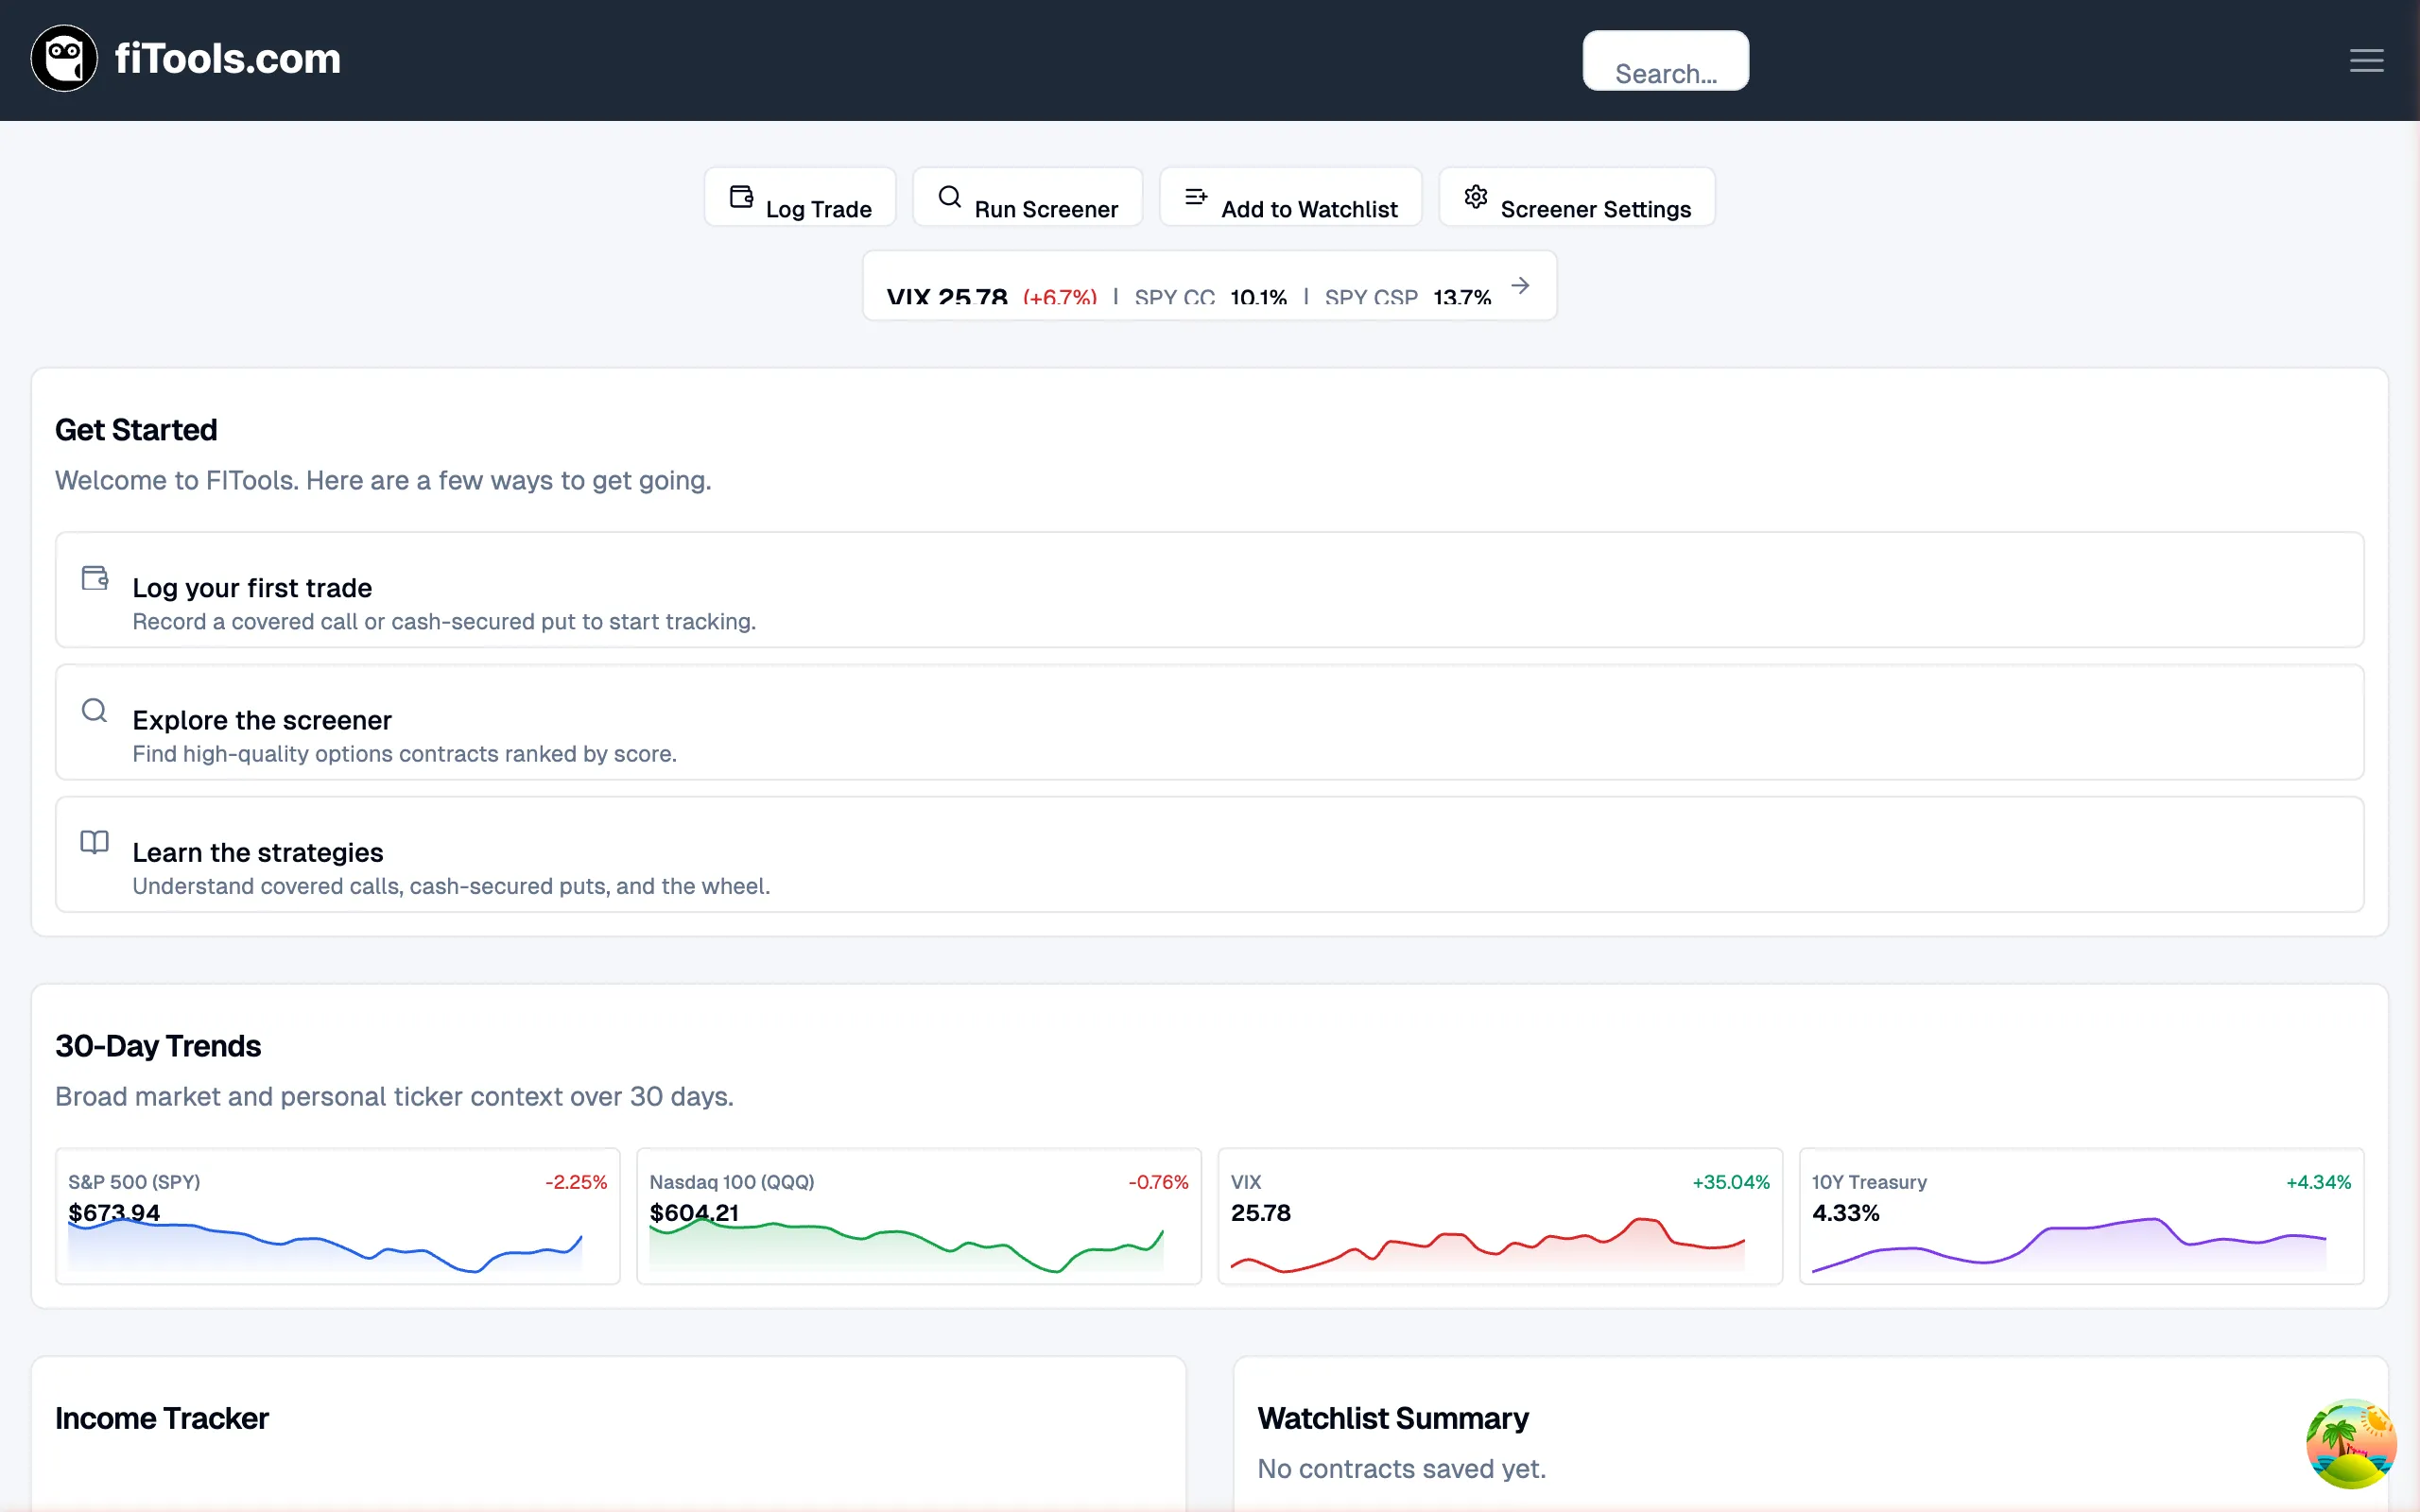
Quick Actions Bar
Section titled “Quick Actions Bar”The top row of buttons gives you one-click access to the most common tasks:
- Log Trade — record a covered call or cash-secured put you’ve already placed
- Run Screener — jump straight to the options screener
- Add to Watchlist — save a ticker for monitoring
- Screener Settings — configure your default screener filters and strategy preferences
Market Strip
Section titled “Market Strip”To the right of the quick actions you’ll see the Market Strip — a compact summary of current market conditions. It shows the VIX level (with daily change), SPY covered call yield, and SPY cash-secured put yield. Click the arrow to open the full Seller’s Climate page.
Getting started
Section titled “Getting started”When you first sign up, the dashboard shows onboarding waypoints that guide you through the key first steps: logging your first trade, exploring the screener, and learning the supported strategies. These waypoints disappear once you have active positions.
30-Day Trends
Section titled “30-Day Trends”Below the onboarding section, the 30-Day Trends card displays sparkline charts for the S&P 500, Nasdaq, VIX, and 10-Year Treasury over the past 30 days. If you have open positions, your personal tickers appear here too.
Income Tracker and Watchlist Summary
Section titled “Income Tracker and Watchlist Summary”At the bottom of the dashboard, two summary cards give you a quick pulse check:
- Income Tracker — your year-to-date premium income and monthly average
- Watchlist Summary — contracts you’ve saved from the screener for follow-up
Options Screener
Section titled “Options Screener”The options screener is the core discovery tool. It surfaces high-quality covered call and cash-secured put opportunities ranked by the FITools score.
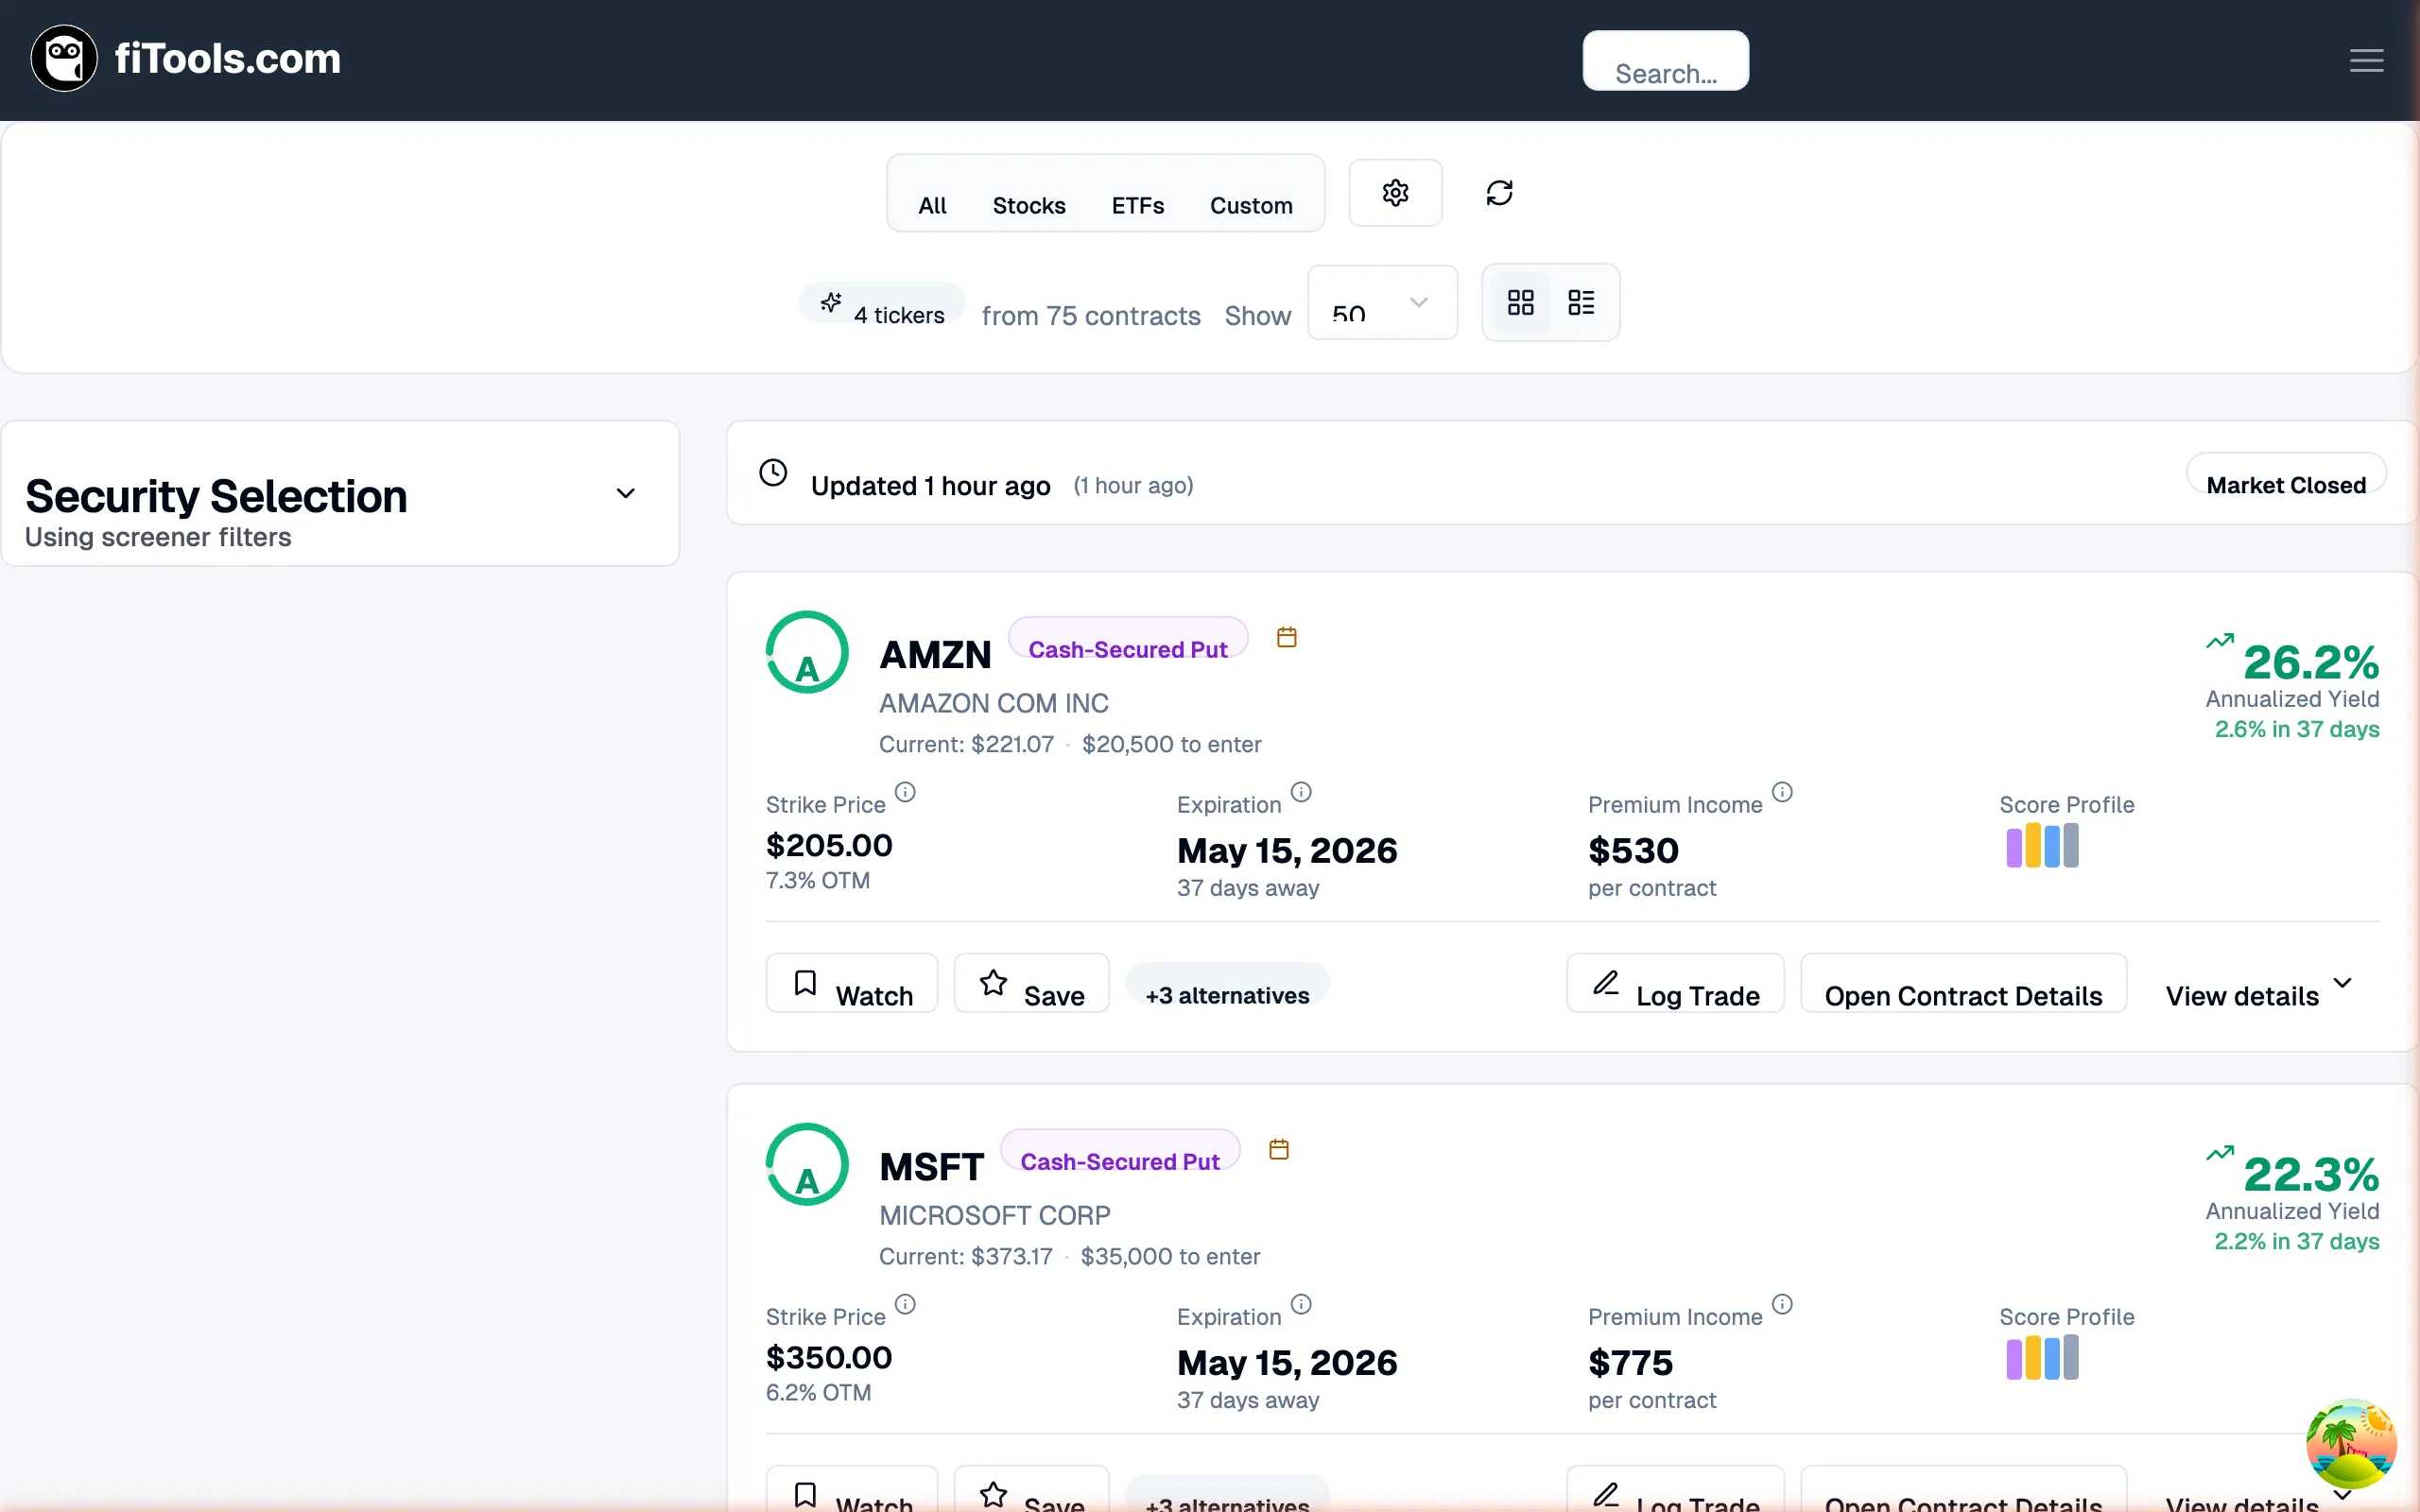
Controls bar
Section titled “Controls bar”Across the top you’ll find:
- Security type tabs — filter by All, Stocks, ETFs, or Custom (your watchlist)
- Filter Options — open a panel to adjust delta range, days to expiration, minimum score, and other criteria
- View toggle — switch between card view (shown above) and a compact table view
- Show count — control how many results appear per page
Security Selection
Section titled “Security Selection”The left sidebar lets you narrow results to specific tickers. By default the screener uses your configured screener filters, but you can switch to your watchlist or manually pick individual companies.
Result cards
Section titled “Result cards”Each card shows the key details for one option contract:
- Ticker and strategy type (e.g., AMZN Cash-Secured Put)
- Strike price and how far out of the money it is
- Expiration date and days remaining
- Premium income per contract
- Score Profile — a visual bar showing the FITools score breakdown
- Annualized yield — the return if the contract expires worthless, annualized
Below the details, action buttons let you Watch the contract, Save it, see alternatives at nearby strikes, Log Trade, or Open Contract Details for deeper analysis.
Data freshness
Section titled “Data freshness”A banner above the results shows when data was last updated and whether the market is open or closed. You can click the refresh icon to pull the latest quotes.
Company Screener
Section titled “Company Screener”The company screener helps you find quality companies using fundamental analysis criteria — a good starting point before looking at their options.
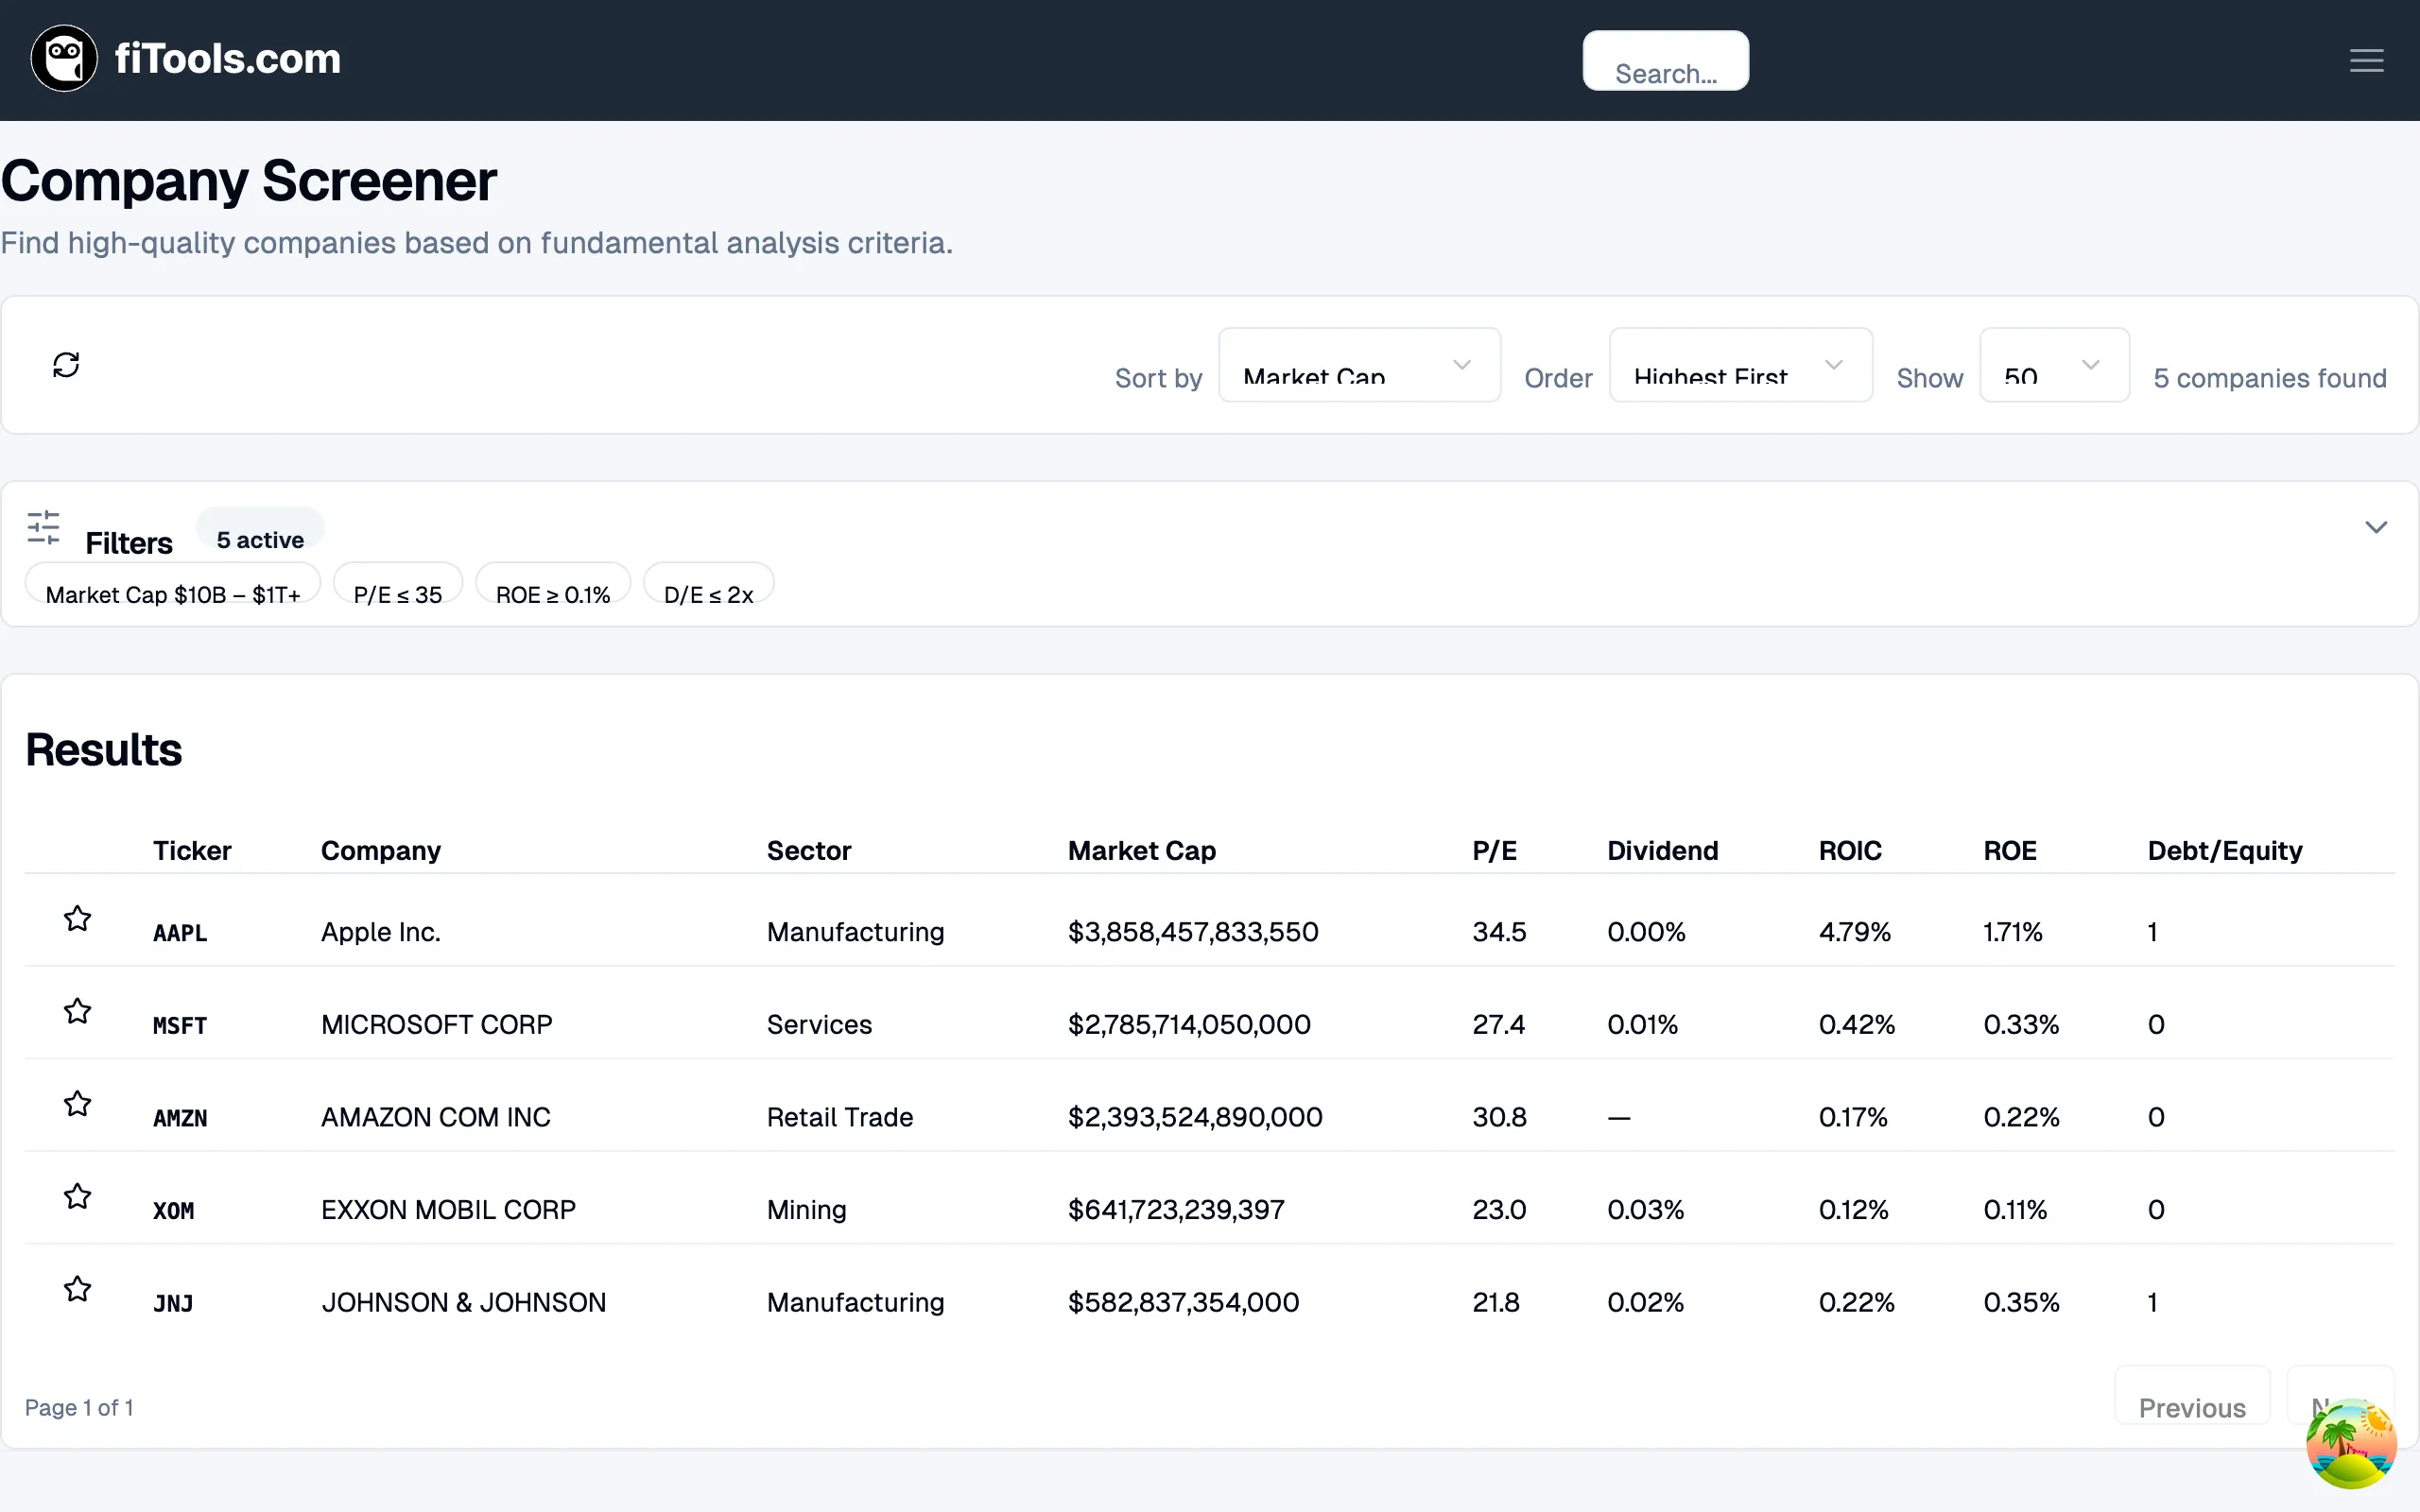
Filters
Section titled “Filters”Active filters appear as chips below the header. The default set screens for large-cap companies with reasonable valuations and solid fundamentals (Market Cap, P/E, ROE, Debt/Equity). You can expand the filter panel to customize these.
Results table
Section titled “Results table”The sortable table displays:
- Ticker and Company name (with a watchlist star toggle)
- Sector classification
- Market Cap, P/E, Dividend yield, ROIC, ROE, and Debt/Equity
Click any column header to sort. Click a ticker to open its detail page.
Ticker Details
Section titled “Ticker Details”When you click a ticker anywhere in the app — from screener results, your watchlist, or a search — you land on the ticker detail page.
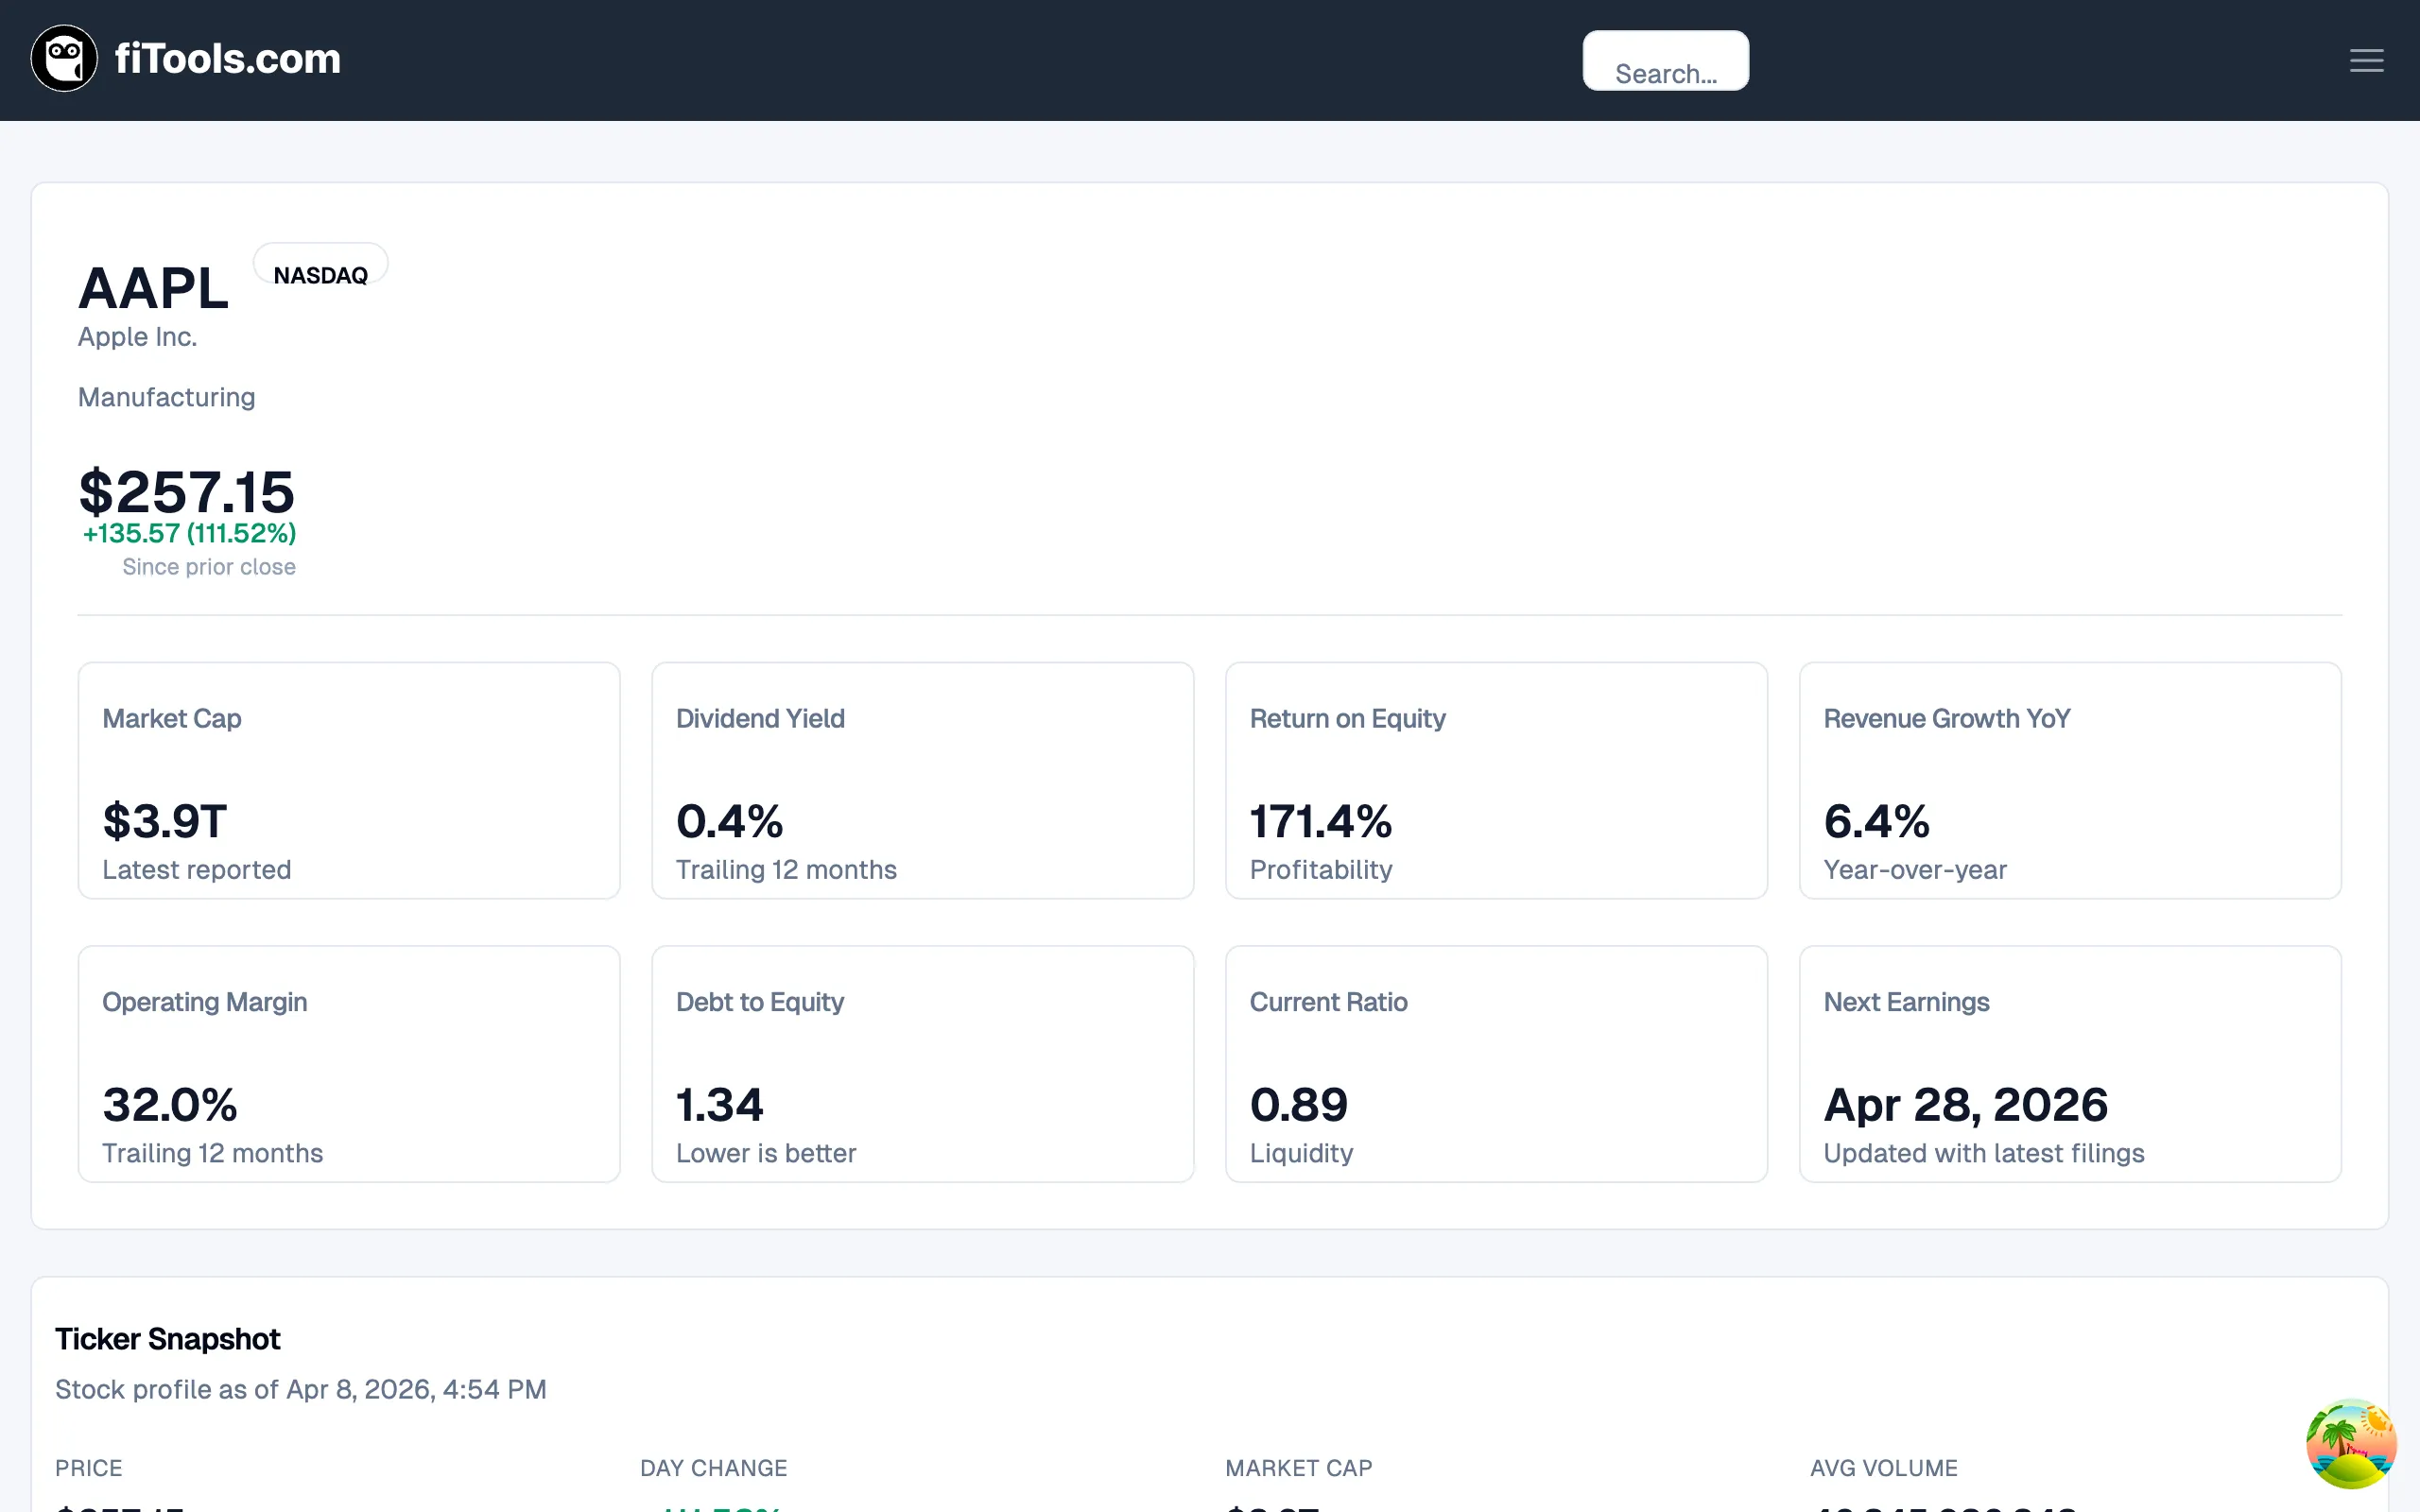
Company header
Section titled “Company header”The top section shows the ticker symbol, exchange badge (e.g., NASDAQ), company name, sector, current price, and daily change.
Fundamentals grid
Section titled “Fundamentals grid”Eight cards summarize the company’s financial health:
- Market Cap — total company valuation
- Dividend Yield — trailing 12-month dividend return
- Return on Equity — profitability measure
- Revenue Growth YoY — year-over-year revenue change
- Operating Margin — trailing 12-month operating efficiency
- Debt to Equity — leverage ratio
- Current Ratio — short-term liquidity
- Next Earnings — upcoming earnings report date
Ticker Snapshot and more
Section titled “Ticker Snapshot and more”Below the fundamentals grid, additional sections include the Ticker Snapshot (price, daily change, market cap, volume), an options chain browser, price charts, and financial history tabs covering valuation, profitability, growth, balance sheet, and cash flow.
Seller’s Climate
Section titled “Seller’s Climate”The Seller’s Climate page provides macro context to help you decide whether now is a good time to sell premium.
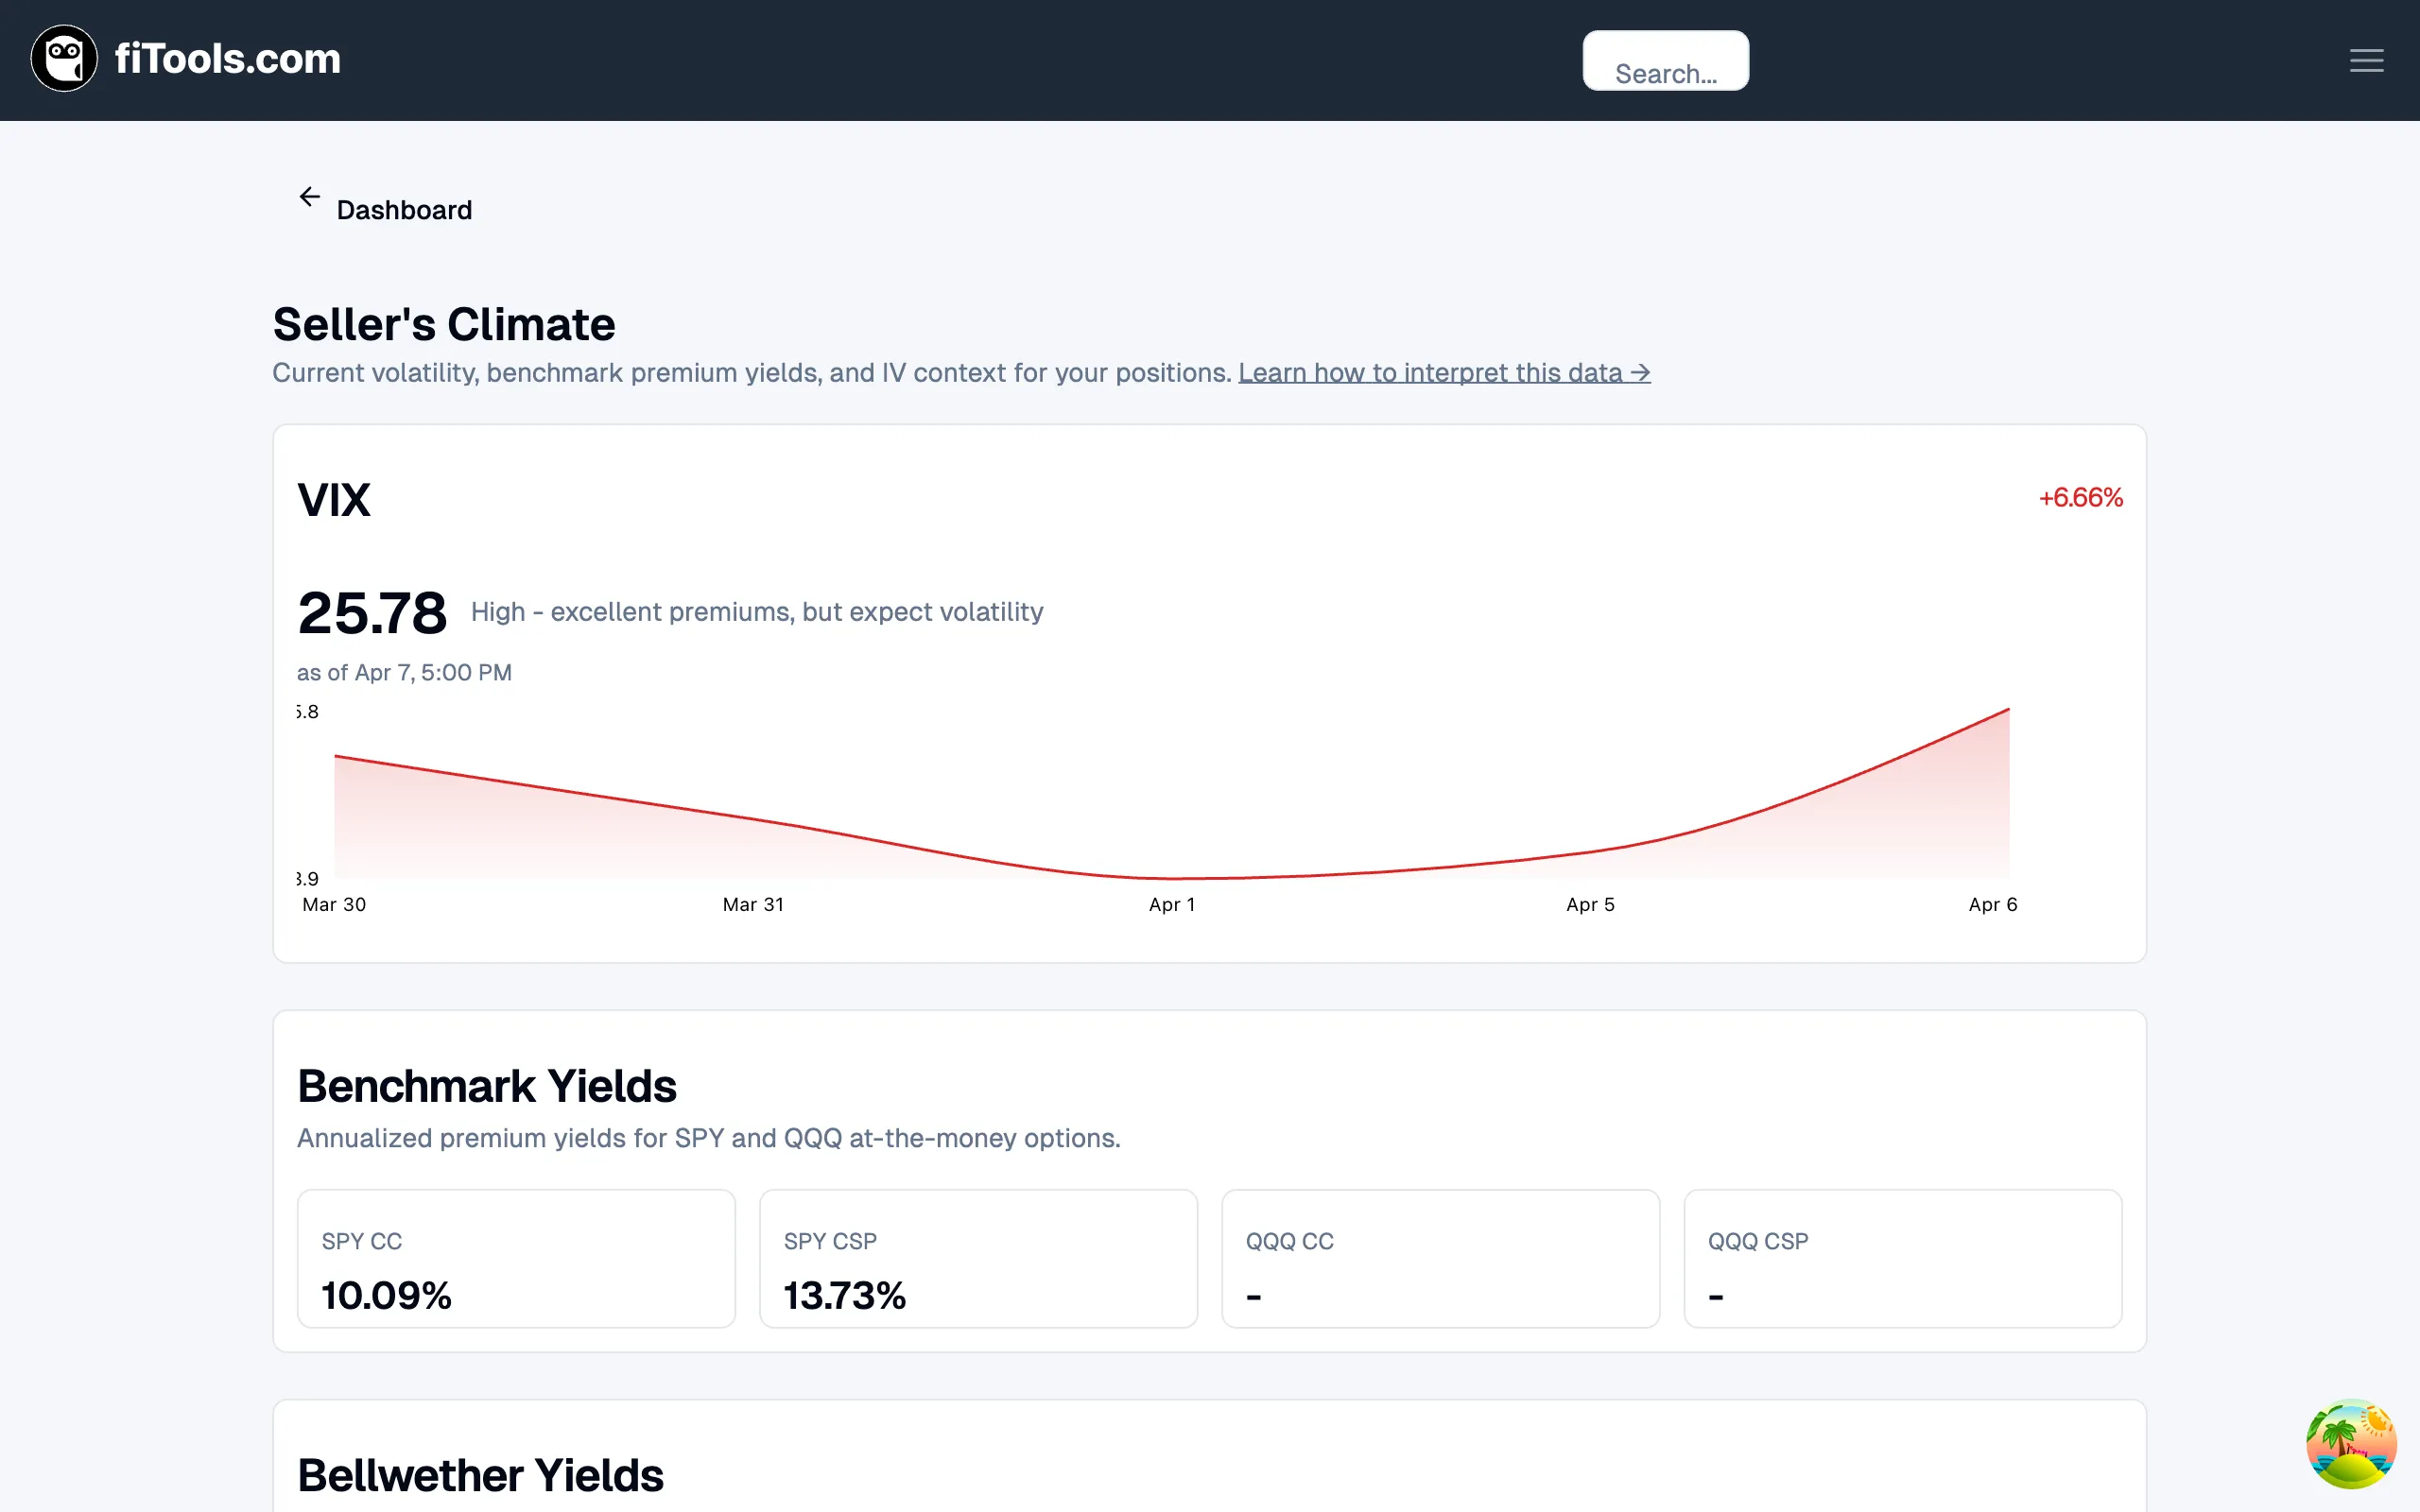
VIX overview
Section titled “VIX overview”The VIX card shows the current level, its daily change, and a plain-English assessment (e.g., “High — excellent premiums, but expect volatility”). A sparkline chart plots the VIX over the past several trading days.
Benchmark Yields
Section titled “Benchmark Yields”This section shows the annualized premium yields for at-the-money SPY and QQQ options — both covered calls and cash-secured puts. These serve as a baseline to evaluate whether a specific contract’s yield is above or below the market average.
Bellwether Yields
Section titled “Bellwether Yields”Below the benchmarks, you’ll find yields for individual bellwether stocks across sectors, giving you a sense of where premium is richest.
Options Dashboard
Section titled “Options Dashboard”The Options Dashboard (accessible from the Income link or /income) is where you track your premium income and manage positions.
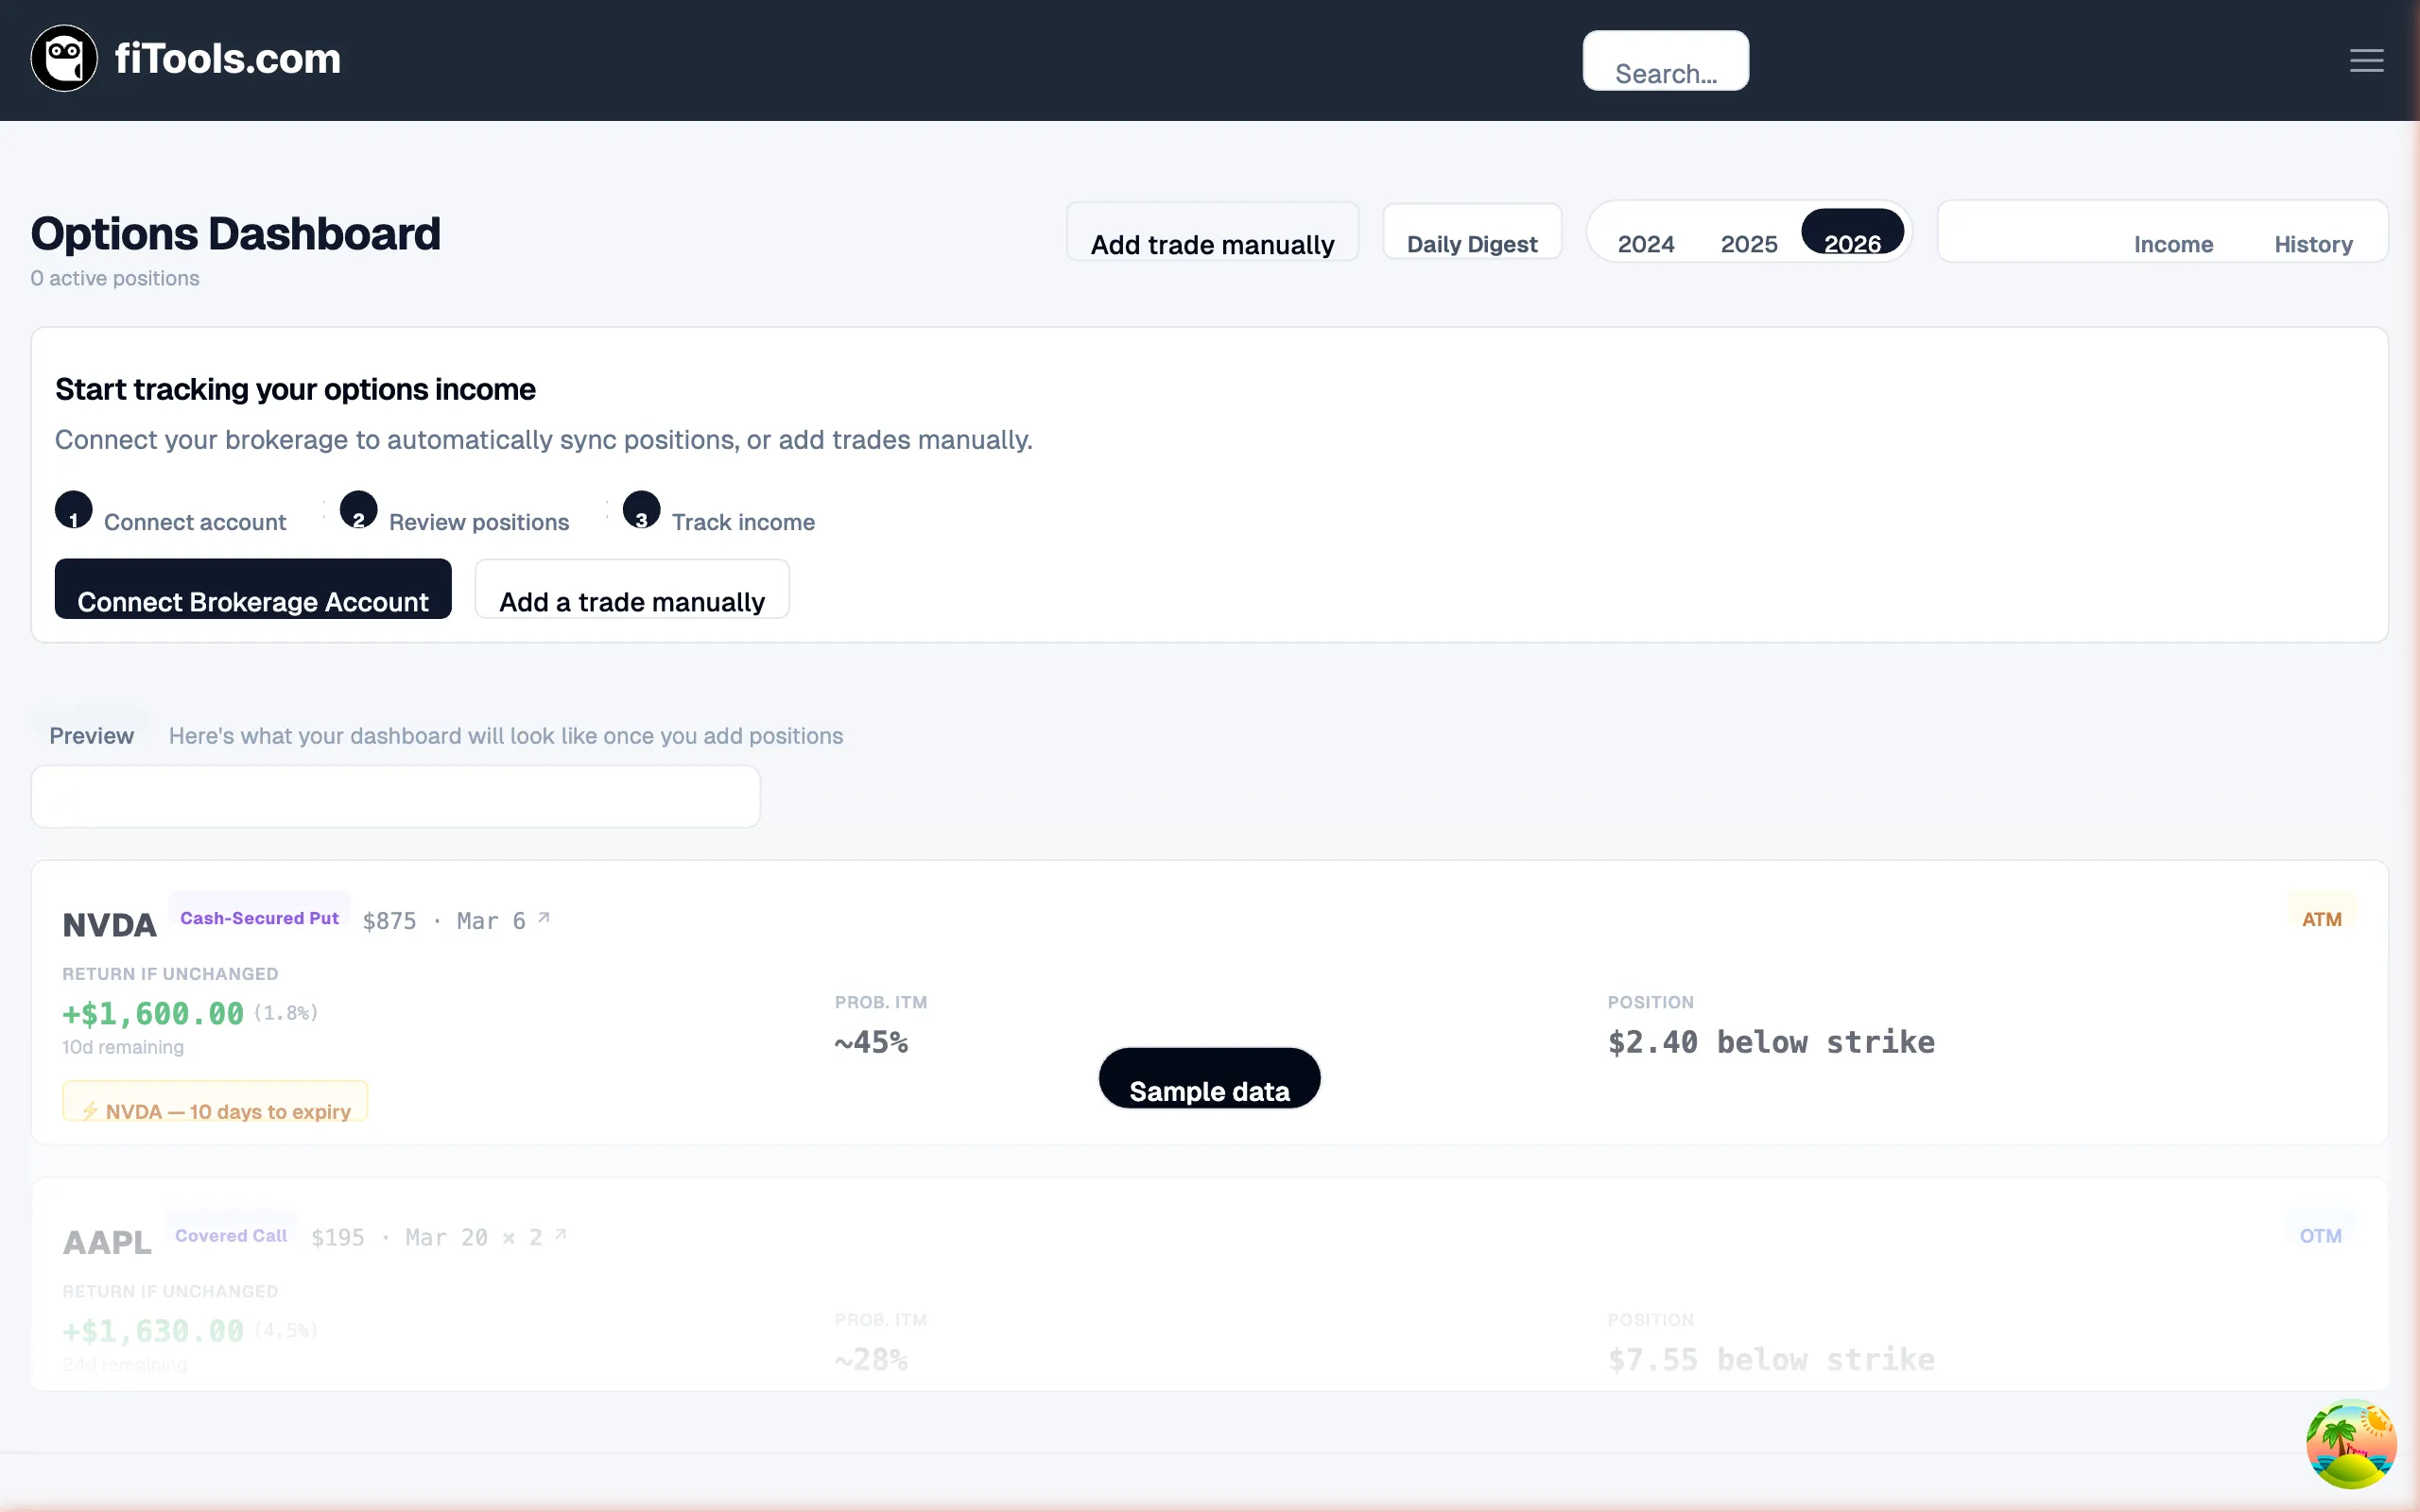
Summary stats
Section titled “Summary stats”Five cards across the top show:
- YTD Income — total premium collected this year
- Avg Monthly — average monthly income
- Premium in Play — unrealized premium from open positions
- Capital Deployed — total capital committed to open positions
- Annualized Yield — your portfolio’s annualized return from premium income
Toggle between three views using the tabs:
- Positions — your current open positions with strategy type, ticker, status, and P&L
- Income — a chronological log of every premium and dividend payment received
- History — closed positions and their outcomes
Filters
Section titled “Filters”Narrow the position list by category: All, Notifications (positions needing attention), Covered Calls, or Cash-Secured Puts.
Year selector
Section titled “Year selector”Switch between years (2024, 2025, 2026) to review historical performance. You can also open the Daily Digest for a summary of today’s activity.
Navigation
Section titled “Navigation”Top navigation bar
Section titled “Top navigation bar”The top bar is consistent across every page:
- FITools logo — click to return to the dashboard
- Search (
Cmd+K) — find any company by name or ticker symbol - Account menu — access your account settings, linked brokerage accounts, and sign out
Getting around
Section titled “Getting around”There’s no sidebar menu — navigation happens through the dashboard’s quick actions, the search bar, and links within pages. The most common flows:
- Dashboard -> Quick Action buttons -> Screener or Log Trade
- Screener result card -> Open Contract Details -> Ticker page
- Market Strip -> Seller’s Climate page
- Income link -> Options Dashboard
Next Steps
Section titled “Next Steps”Now that you know your way around:
- Set up your account and connect a brokerage
- Run the screener to find your first trade
- Log a trade to start tracking income