Option Contract Detail
The Option Contract page gives you a complete picture of a single option contract — returns analysis, expiration scenarios, live Greeks, volatility context, and nearby strike alternatives — all on one screen. If you already own the contract, the page adapts to show your position health, P&L, and assignment risk instead of a generic browsing view.
You can reach a contract page from the Options Screener (click Open Contract Details), from a ticker detail page, or directly at /option/[optionCode] using the OCC option symbol.
Returns and break-even analysis
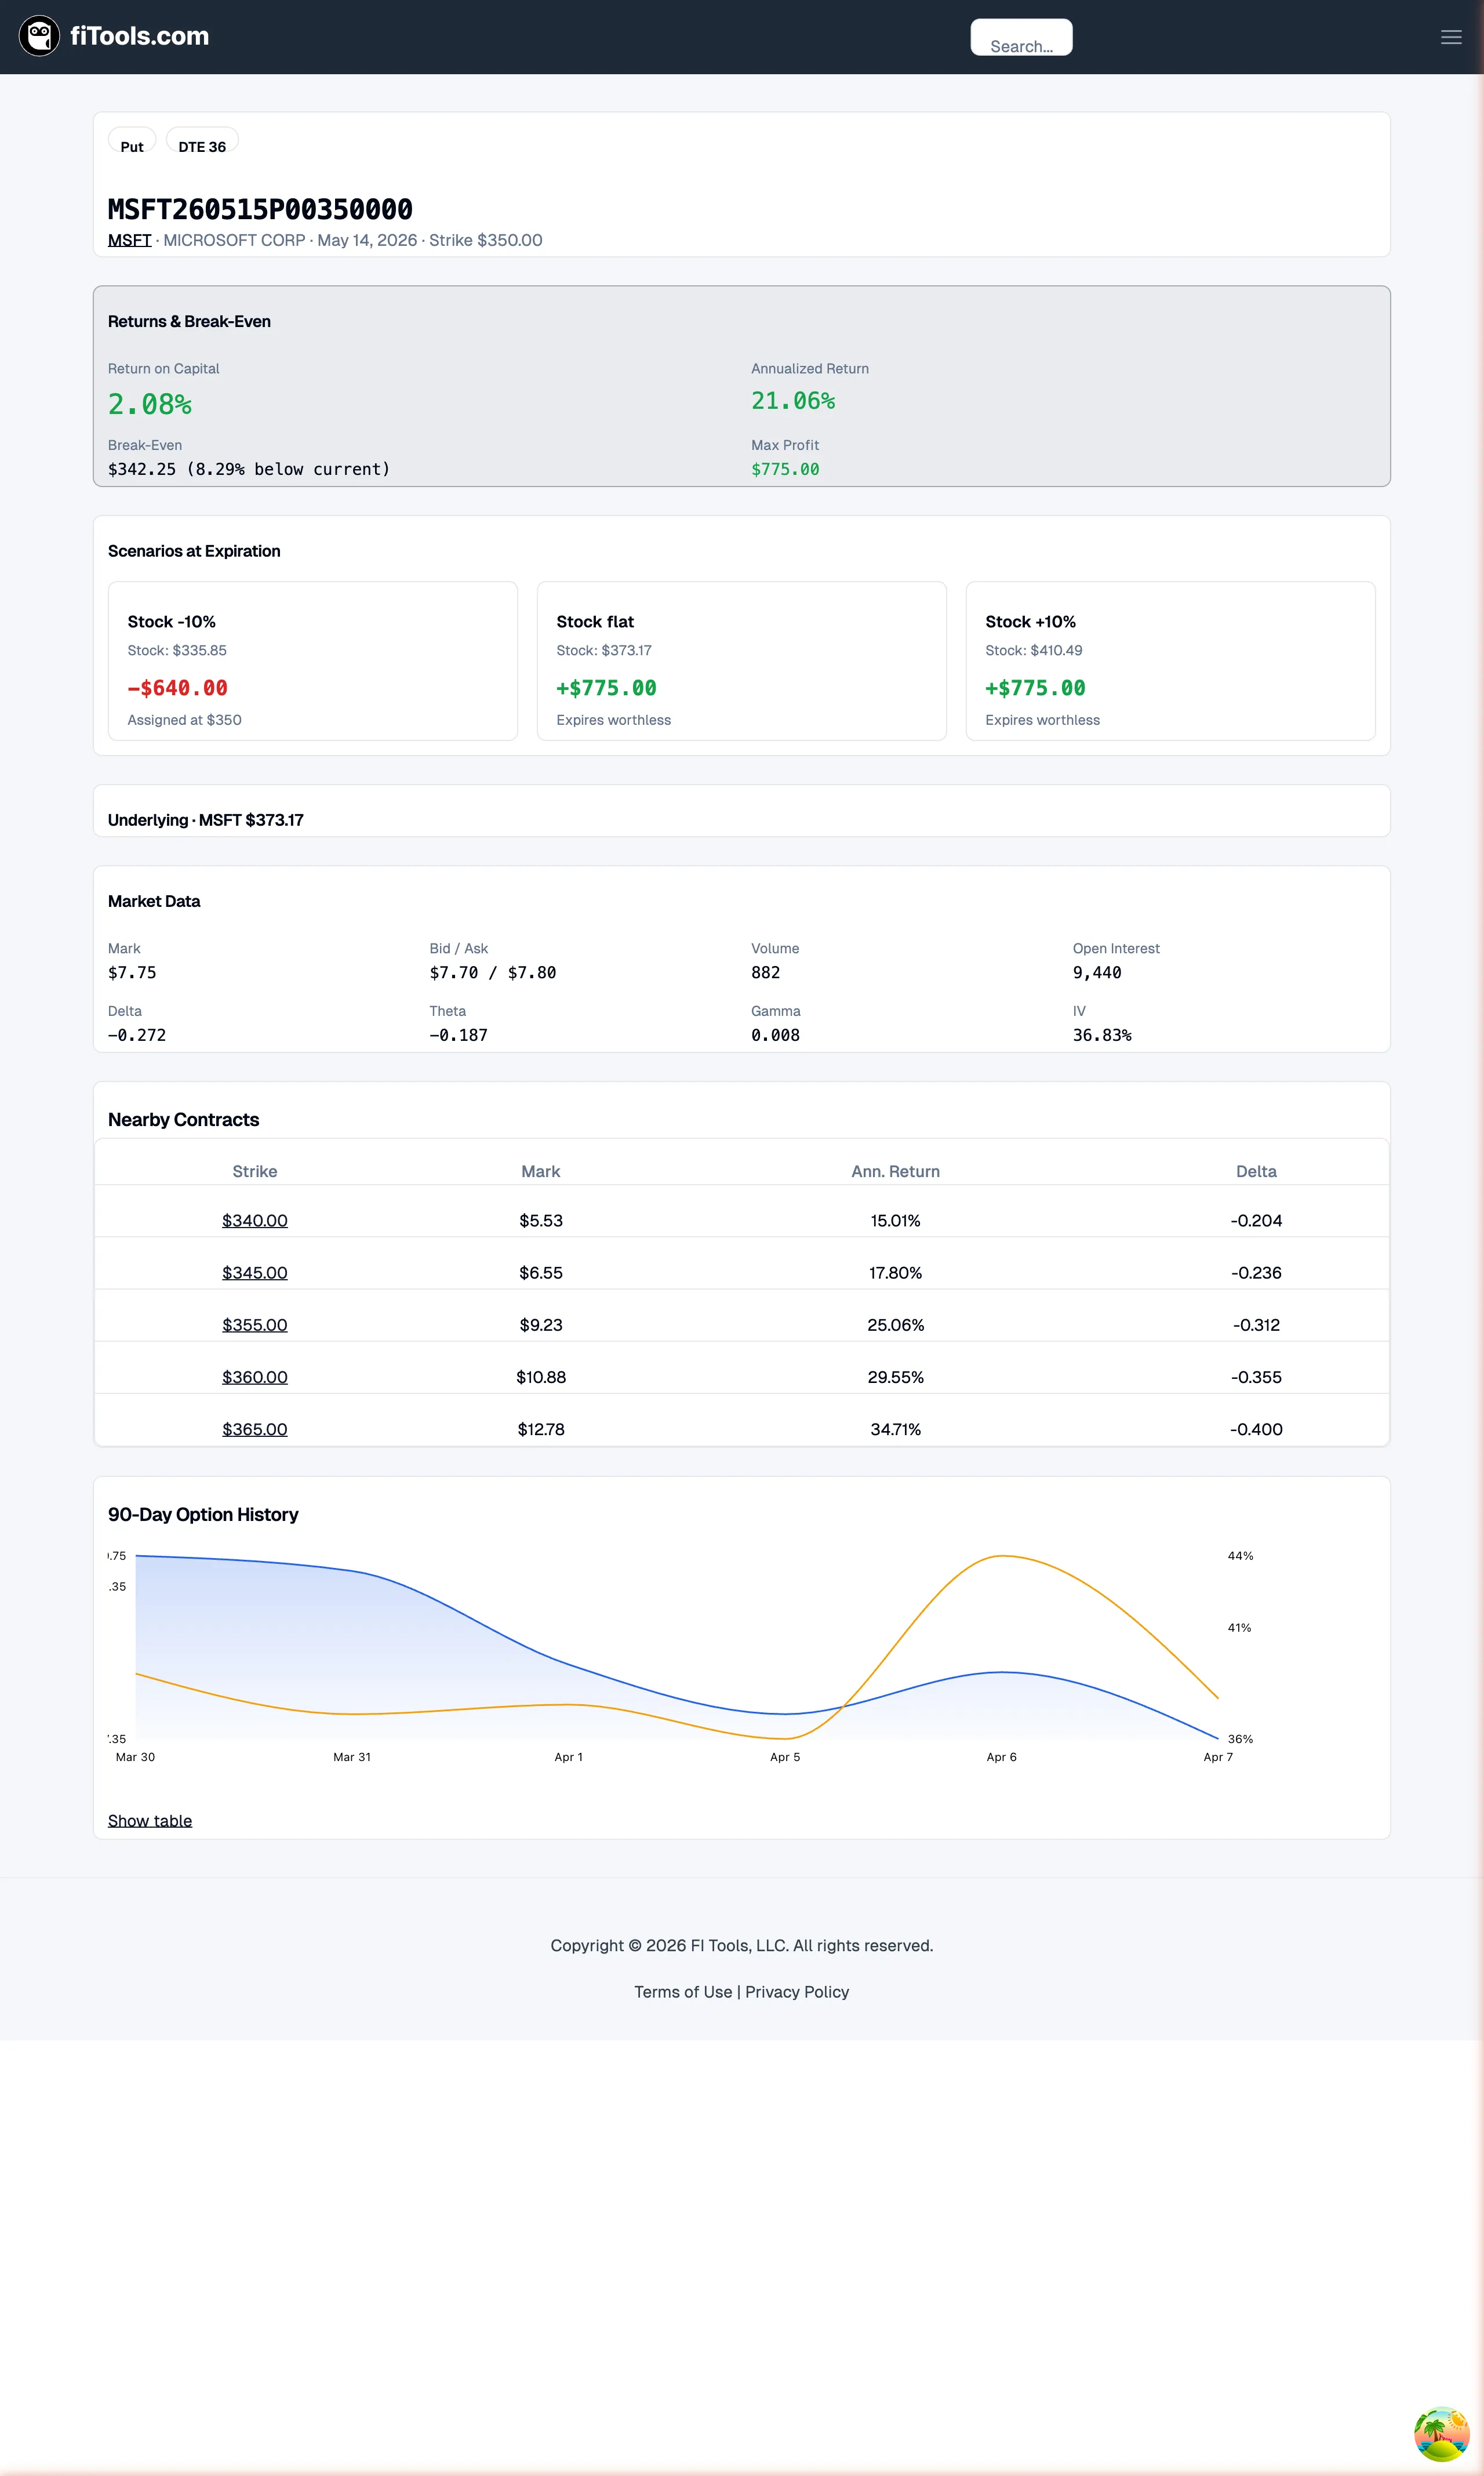
Section titled “Returns and break-even analysis”The Returns & Break-Even card is the first thing you see when browsing a contract you do not own. It answers the core question: “What do I earn if this trade works out?”
Four metrics are displayed in a two-by-two grid:
- Return on Capital — the percentage return you earn on the capital required to enter the position. For a cash-secured put, this is premium divided by cash collateral; for a covered call, premium divided by the share cost.
- Annualized Return — the same return scaled to a yearly rate so you can compare contracts with different expirations on equal footing.
- Break-Even — the underlying stock price at which the trade neither makes nor loses money, shown as a dollar amount and a percentage distance from the current stock price (for example, “3.25% below current”).
- Max Profit — the most you can earn from the trade, calculated as the premium received multiplied by 100 shares per contract.
Scenarios at expiration
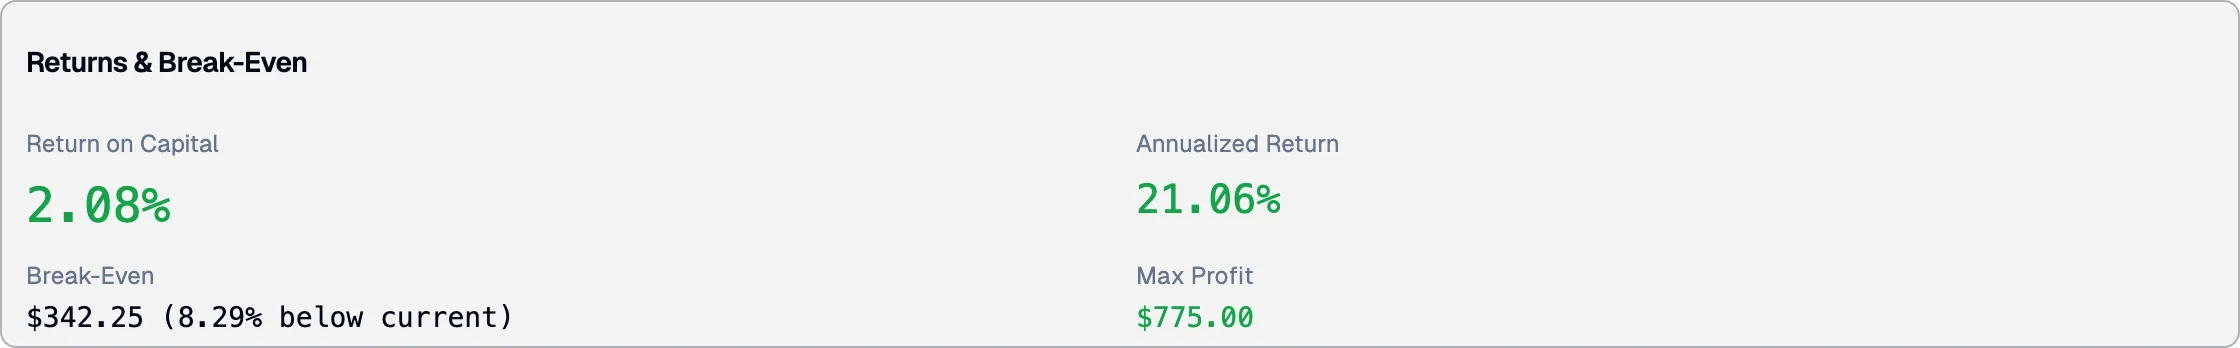
Section titled “Scenarios at expiration”The Scenarios at Expiration grid models what happens to your position under different stock price movements at expiration. Each scenario card shows a label, the projected stock price, the dollar P&L, and a short description.
Typical scenarios include:
- Stock up 10% — shows the P&L if the underlying rallies by the given percentage.
- Stock unchanged — shows the P&L if the stock stays at its current price through expiration.
- Stock down 10% — shows the P&L if the underlying drops by the given percentage.
P&L values are color-coded green for profit and red for loss so you can spot the risk and reward profile at a glance. The scenarios account for your entry price and quantity when you own the contract, giving you a personalized view rather than a generic one.
Market data and Greeks
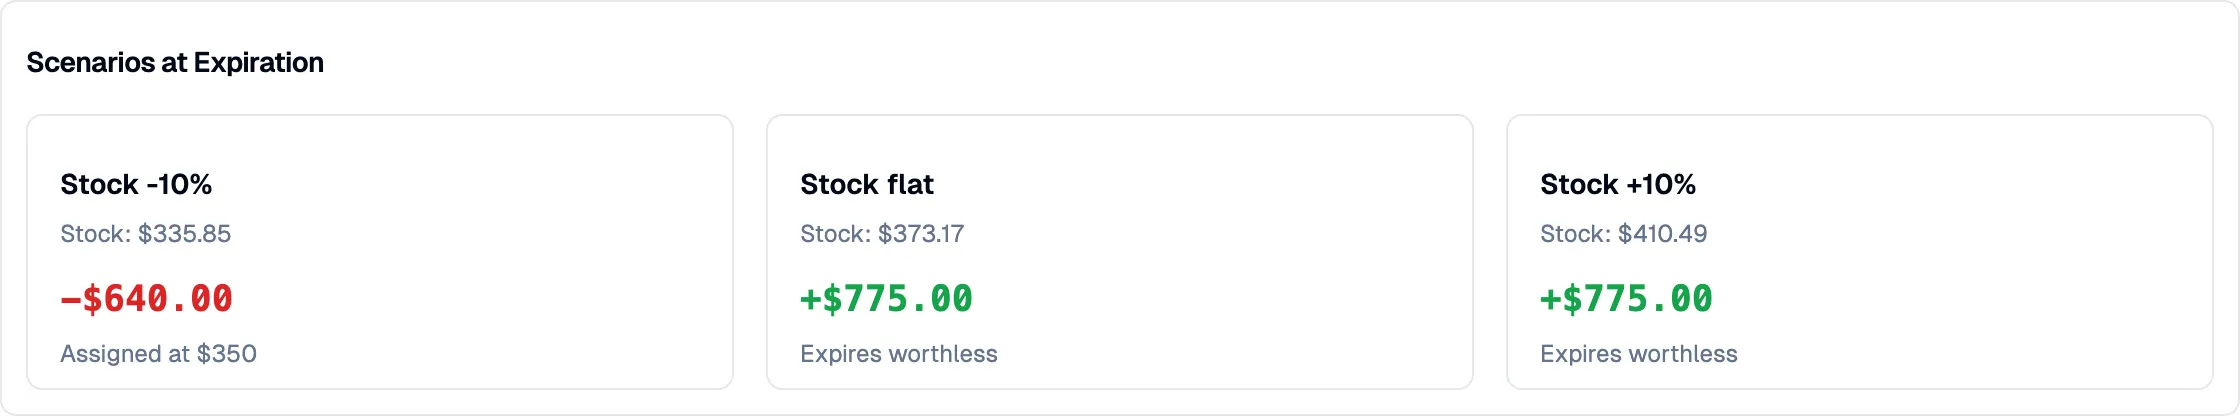
Section titled “Market data and Greeks”The Market Data card provides the live pricing and Greek values for the contract, laid out in a compact grid.
The grid displays eight data points:
| Metric | What it tells you |
|---|---|
| Mark | Mid-price between bid and ask, your best estimate of fair value |
| Bid / Ask | Current bid and ask prices, showing the spread you pay to enter or exit |
| Volume | Number of contracts traded today, indicating current-day interest |
| Open Interest | Total outstanding contracts, reflecting sustained market participation |
| Delta | Sensitivity to a $1 move in the underlying — also a rough proxy for probability of expiring ITM |
| Theta | Daily time decay in dollars, showing how much value the option loses each day |
| Gamma | Rate of change of delta, important as the stock approaches your strike |
| IV | Implied volatility, the market’s expectation of future price movement baked into the premium |
Underlying and IV context
Section titled “Underlying and IV context”Two smaller cards appear below the Market Data grid to give you context about the stock and the volatility environment.
Underlying Context shows the ticker symbol, current stock price, and — when available — the next earnings date with how many days before or after expiration it falls. This helps you avoid selling options that span an earnings event.
IV Context displays three volatility metrics when data is available:
- IV Rank — where current IV sits relative to its range over the past year (0-100%).
- IV Percentile — what percentage of days in the past year had lower IV than today.
- HV 30d — the stock’s realized (historical) volatility over the last 30 days.
High IV Rank or IV Percentile values (above 50%) suggest implied volatility is elevated, which generally favors option sellers.
Nearby contracts
Section titled “Nearby contracts”When you are browsing a contract you do not own, the Nearby Contracts table shows up to five alternative contracts at adjacent strike prices within $15 of the current strike, all sharing the same expiration and option type.
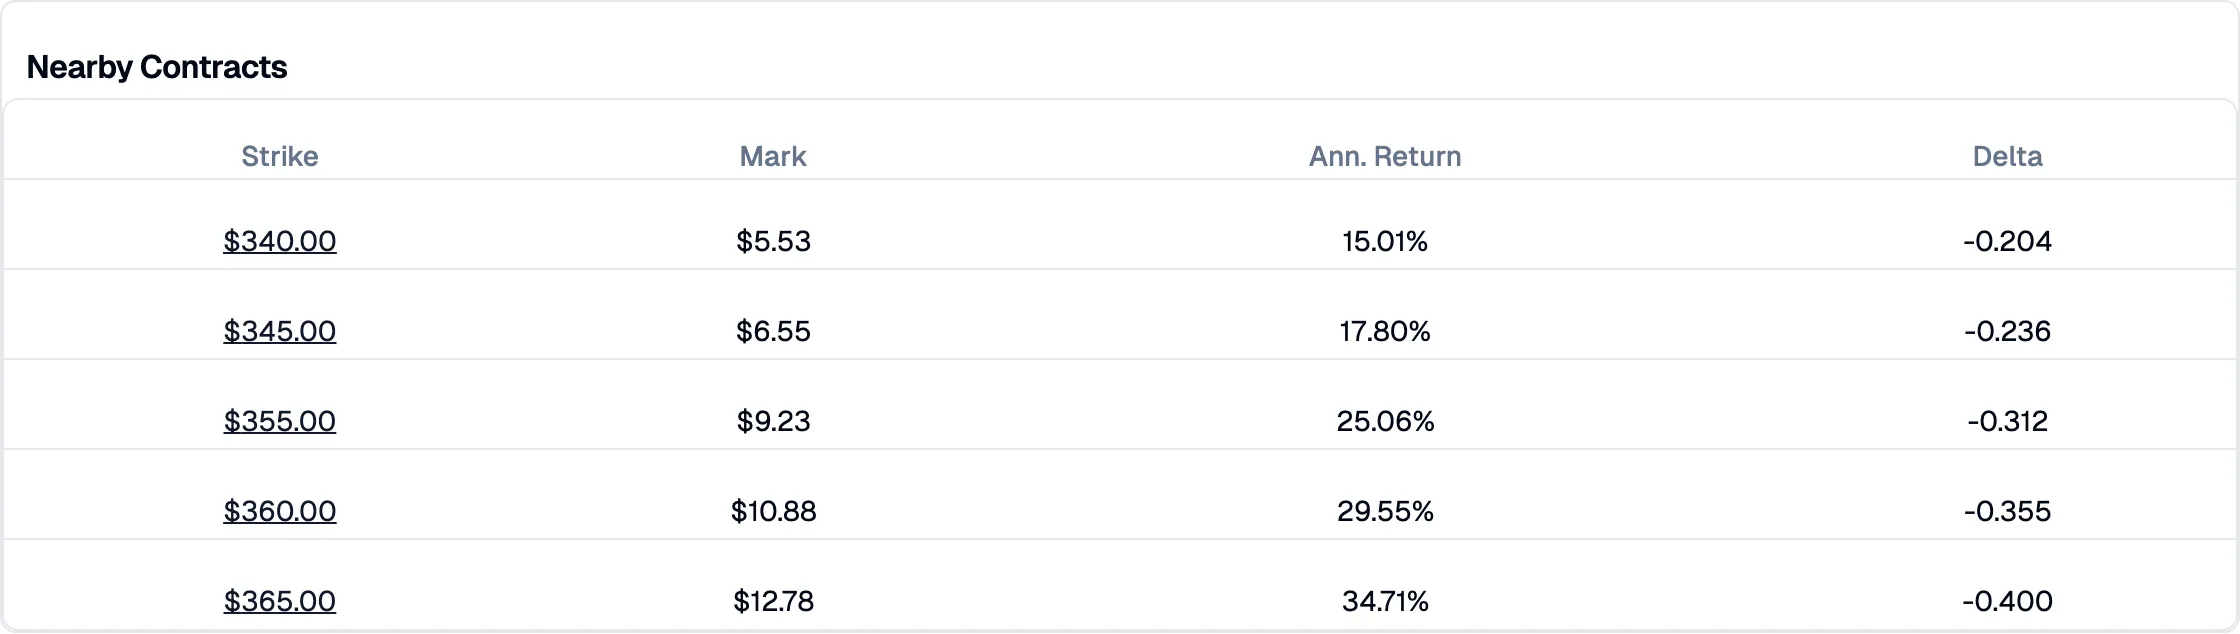
Each row displays:
- Strike — the strike price, linked to that contract’s detail page so you can navigate with one click.
- Mark — the mid-price for the alternative contract.
- Ann. Return — the annualized return if the stock stays unchanged, letting you compare yield across strikes.
- Delta — the delta value so you can gauge how far in or out of the money each alternative is.
The row for the contract you are currently viewing is highlighted with a muted background. All other strikes are clickable links that take you to their own contract detail page.
Owned position view
Section titled “Owned position view”When FITools detects that you hold an open position on the contract, the page layout shifts to put your position front and center.
Position Health card
Section titled “Position Health card”A green-tinted Position Health card replaces the hero Returns card at the top of the page. It shows:
- Unrealized P&L — your current profit or loss in dollars and as a percentage, color-coded green or red.
- Premium Captured — what percentage of the original premium you have already captured through time decay.
- Assignment Risk — a four-level indicator (Minimal, Moderate, High, Critical) that reflects how close the stock is to your strike. Each level is color-coded from green to red.
Below these headline metrics, a details row shows your strategy type (Covered Call or Cash-Secured Put), entry price, contract quantity, and the date you opened the position.
Layout differences
Section titled “Layout differences”The owned-position layout makes several changes compared to the browsing view:
- Position Health appears first, directly below the header.
- Scenarios appear next, personalized with your entry price and quantity.
- Returns card still appears but in standard (non-hero) styling, below scenarios.
- Nearby Contracts is hidden since you have already committed to this strike.
- IV Context and History remain at the bottom for ongoing monitoring.
History
Section titled “History”The 90-Day Option History section anchors the bottom of the page in both the browsing and owned-position views. It includes a dual-axis chart plotting the option’s mark price (blue area, left axis) and implied volatility (amber line, right axis) over the last 90 calendar days.
Hover over the chart to see exact values at any date. Below the chart, a Show table link expands a full data table with columns for Date, Mark, Close, IV, Volume, and Open Interest — useful when you need precise numbers for journaling or analysis.
Related pages
Section titled “Related pages”- Options Screener — find and compare scored option contracts across your universe
- How Covered Calls Work — understand the mechanics of the covered call strategy
- How Cash-Secured Puts Work — learn the cash-secured put strategy
- Choosing Strikes and Expirations — guidance on selecting the right contract parameters