Income Dashboard
The Income Dashboard is your central hub for tracking premium income from sold options. It combines active position monitoring, income analytics, and trade history into a single view at /income.
Navigating the dashboard
Section titled “Navigating the dashboard”The dashboard header displays your active position count and the latest market data timestamp. A toolbar across the top gives you access to the key controls:
- Add trade manually opens a dialog to record a trade that was not synced from your brokerage.
- Daily Digest navigates to
/income/digestfor a summary of overnight risk changes. - Year selector lets you switch between years (2024 through the current year) to view historical income.
- View tabs switch between three views: Positions, Income, and History.
Tracking your income
Section titled “Tracking your income”Switch to the Income tab to see your premium income broken down across multiple visualizations.
Summary tiles
Section titled “Summary tiles”Five tiles appear at the top of the income view:
| Tile | What it shows |
|---|---|
| Total YTD Income | All premium collected in the selected year |
| Avg. Monthly Cash Flow | YTD income divided by elapsed months |
| Capital Efficiency | Annualized return on deployed capital |
| Pending Income | Premium from positions still open |
| Capital Deployed | Total capital currently backing your positions |
Monthly and cumulative charts
Section titled “Monthly and cumulative charts”Below the summary tiles, two side-by-side charts visualize your income over time:
- Monthly Income — a stacked bar chart breaking each month into call premium (blue), put premium (green), and dividends (amber).
- Cumulative Income — an area chart showing your running total through the year.
Income by ticker
Section titled “Income by ticker”A horizontal bar chart ranks your holdings by lifetime premium earned. Each row shows the ticker, a proportional bar, the trade count, and the annualized yield column.
Trade timeline and monthly goal
Section titled “Trade timeline and monthly goal”The bottom section contains two cards:
- Trade Timeline lists your ten most recent closed positions, color-coded by outcome (Expired, BTC Profit, Called Away, or Assigned).
- Monthly Income Goal tracks progress toward the goal you set in Settings. A progress bar and percentage indicator update as you collect premium each month.
Reviewing position details
Section titled “Reviewing position details”The Positions tab shows your active option positions grouped by ticker. Filter tabs let you narrow the list to All, Notifications, Covered Calls, or Cash-Secured Puts.
Collapsed card
Section titled “Collapsed card”Each position card shows at a glance:
- Ticker, strategy badge, strike, and expiration
- Return if Unchanged — projected P&L if the stock stays flat through expiration
- Prob. ITM — probability the option finishes in-the-money, derived from delta
- Position — how far the stock price sits above or below the strike
- Rule chips — notification badges when monitoring rules have triggered
Expanded card
Section titled “Expanded card”Click a card to expand it. The expanded view adds:
- Price detail row with current stock price, current premium vs. opened premium, and days to expiration
- Sparkline chart showing the stock price since you opened the position, overlaid with strike and breakeven reference lines
- Decay gauge visualizing how much premium has been captured relative to your profit target
- Metrics grid covering return if unchanged, cost to close, breakeven distance, probability ITM, and context-aware tiles that adapt to your strategy and zone
- Transaction history showing every leg (open, roll, close) on the position
- Educational links that surface relevant handbook articles based on your position’s current state
- Action buttons to mark the position as closed, configure monitoring rules, or explore new rolls
Using the Daily Digest
Section titled “Using the Daily Digest”Navigate to /income/digest by clicking Daily Digest in the dashboard header. The digest surfaces risk changes since your last visit, organized into severity-based sections:
| Section | What it means |
|---|---|
| Need attention | Risk has increased on these positions |
| Newly triggered | Monitoring rules fired since your last digest |
| Risk decreased | Conditions improved on these positions |
| Resolved | Previously flagged items that are no longer active |
Each entry links back to the position card on the main dashboard. A Mark All Acknowledged button lets you clear notifications in bulk.
Browsing trade history
Section titled “Browsing trade history”Switch to the History tab to see a chronological table of every trade event. Use the filter bar to narrow results by:
- Action type — Sold to Open, Bought to Close, Expired Worthless, or Called Away / Assigned
- Ticker — filter to a single underlying
- Search — free-text search across ticker and notes
Click the edit icon on any row to update trade details such as price or notes.
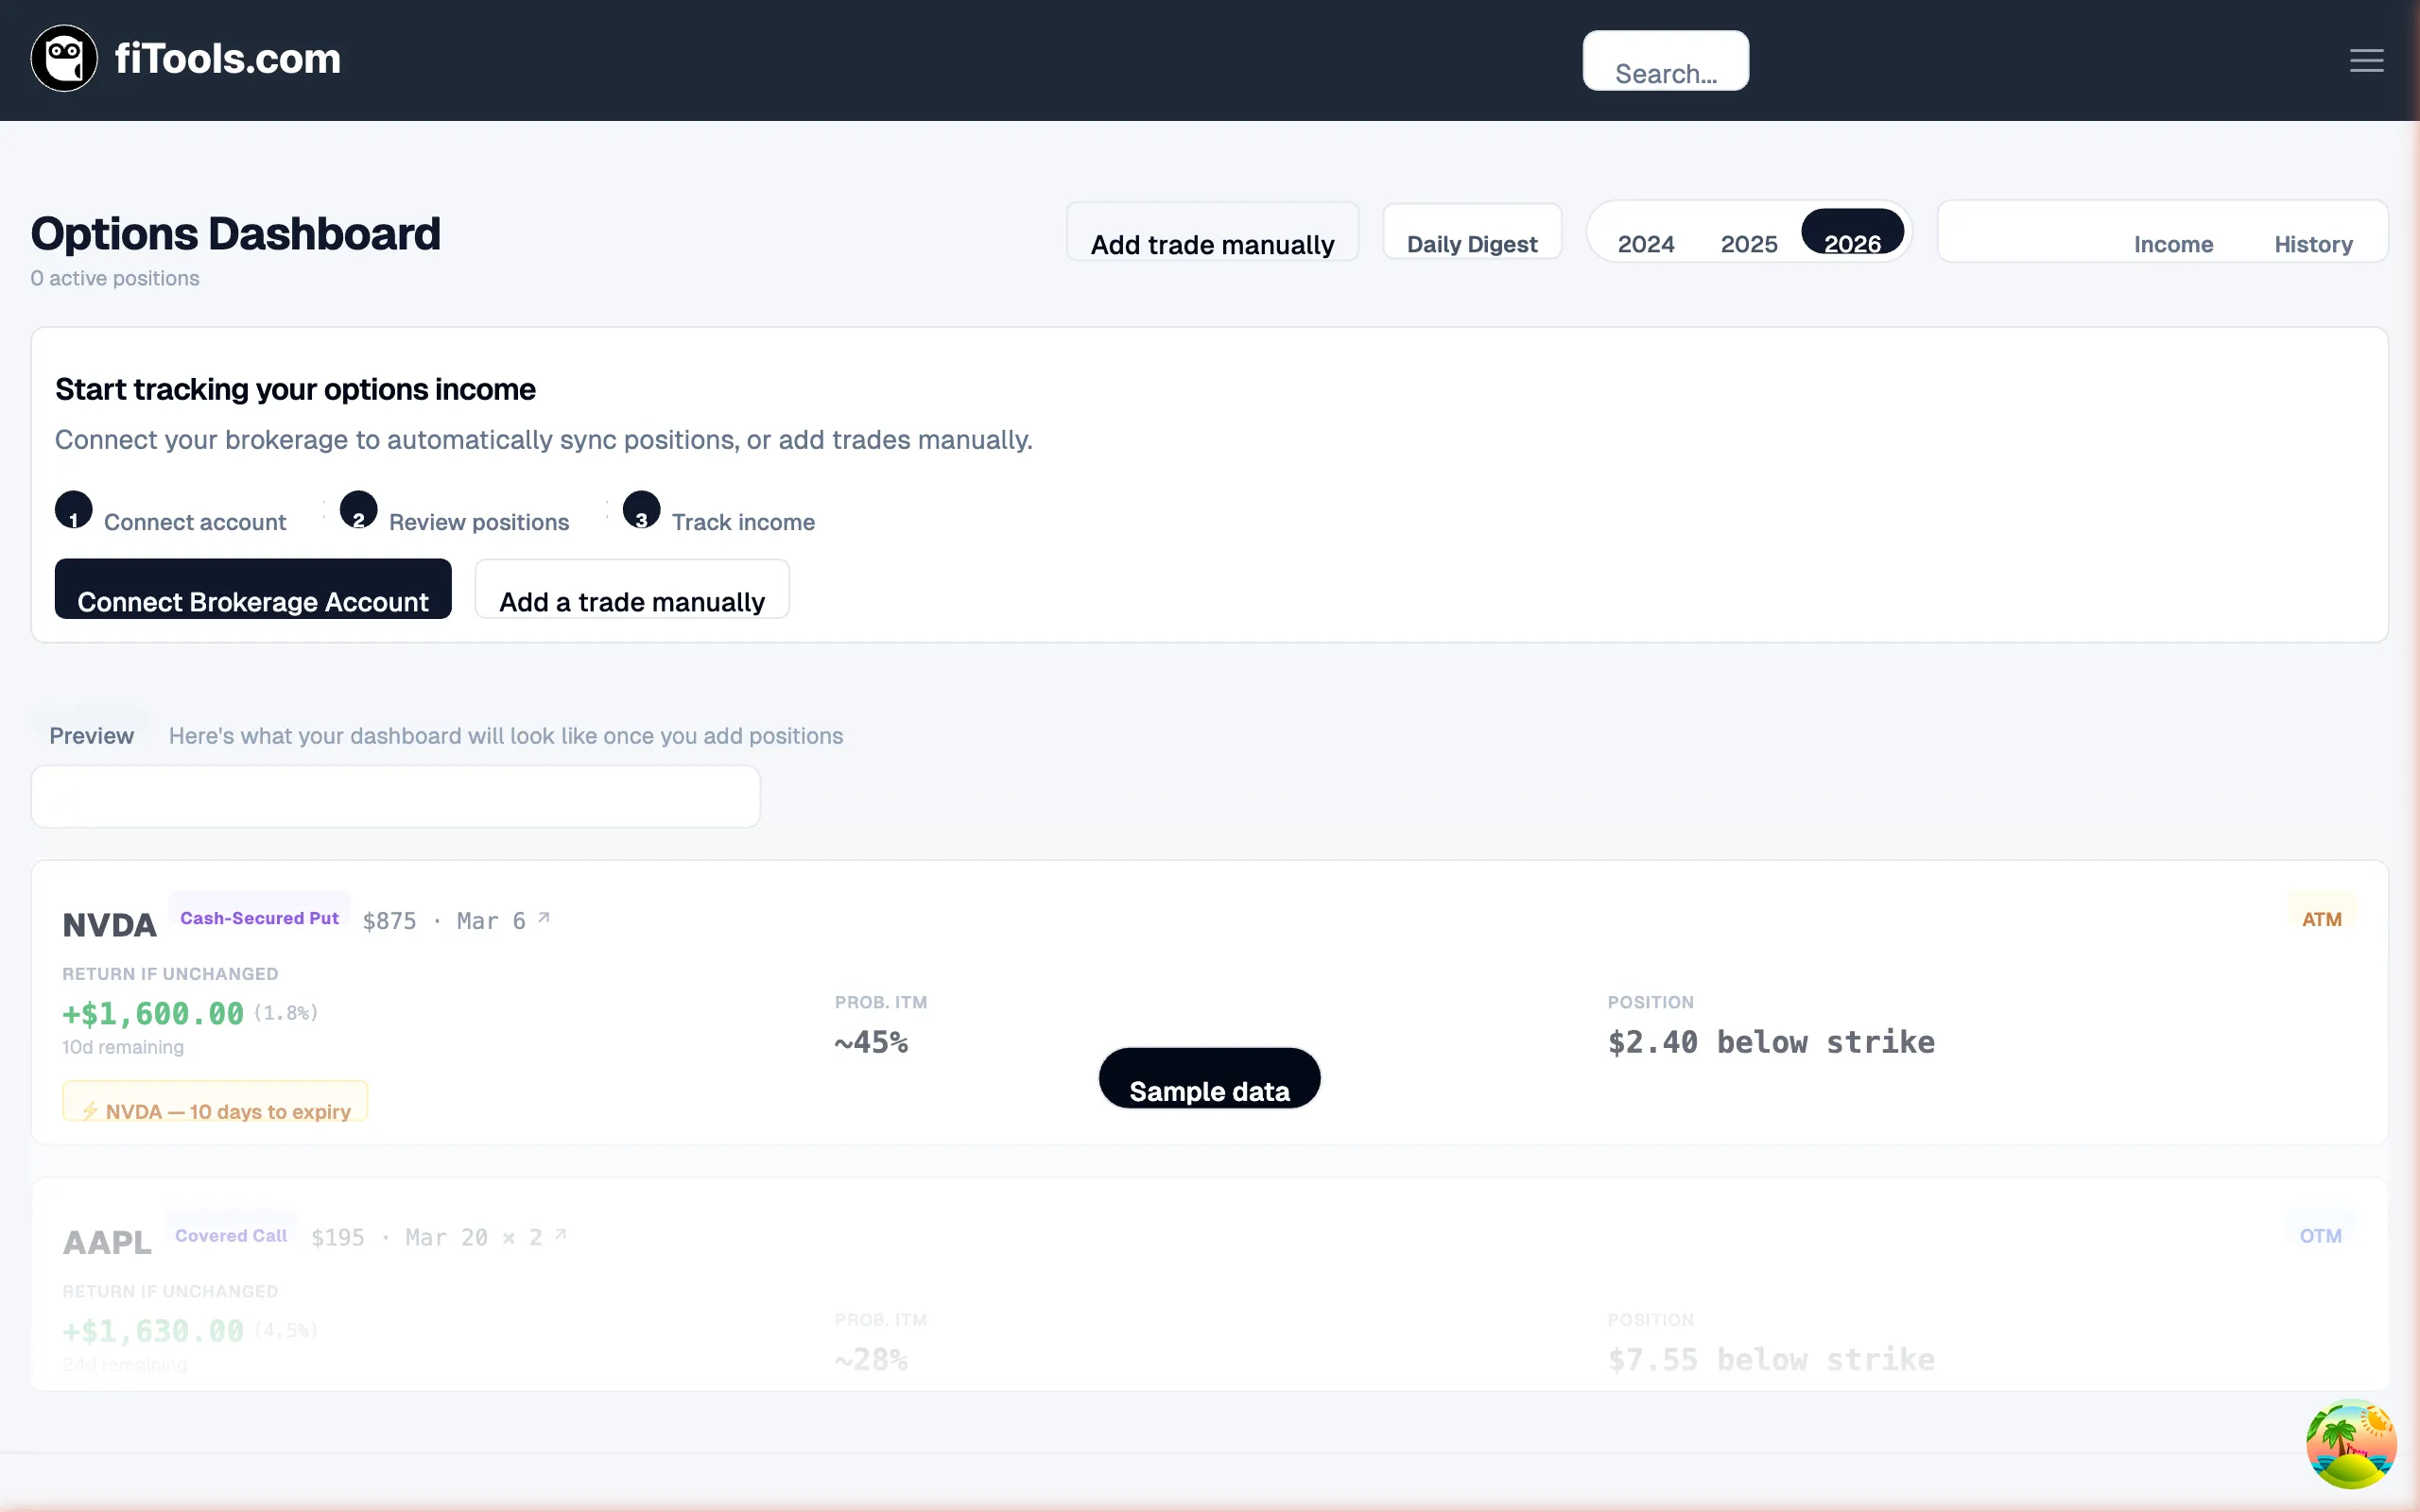
Getting started
Section titled “Getting started”If you have no positions yet, the dashboard displays an onboarding card that walks you through three steps:
- Connect account — link your brokerage under Linked Accounts for automatic position syncing.
- Review positions — verify the imported positions match your broker records.
- Track income — start monitoring your premium income as trades settle.
Below the onboarding card, a blurred sample-data preview shows what the dashboard looks like with real positions, so you know what to expect.