Options Screener
The Options Screener surfaces the best covered call and cash-secured put opportunities across your investment universe. Every contract is scored on four dimensions — volatility edge, downside protection, time decay, and liquidity — so you can focus on trades that match your income goals without wading through raw options chains.
You can reach the screener from the main navigation at Screener > Options, or directly at /screener/options.
Controls bar
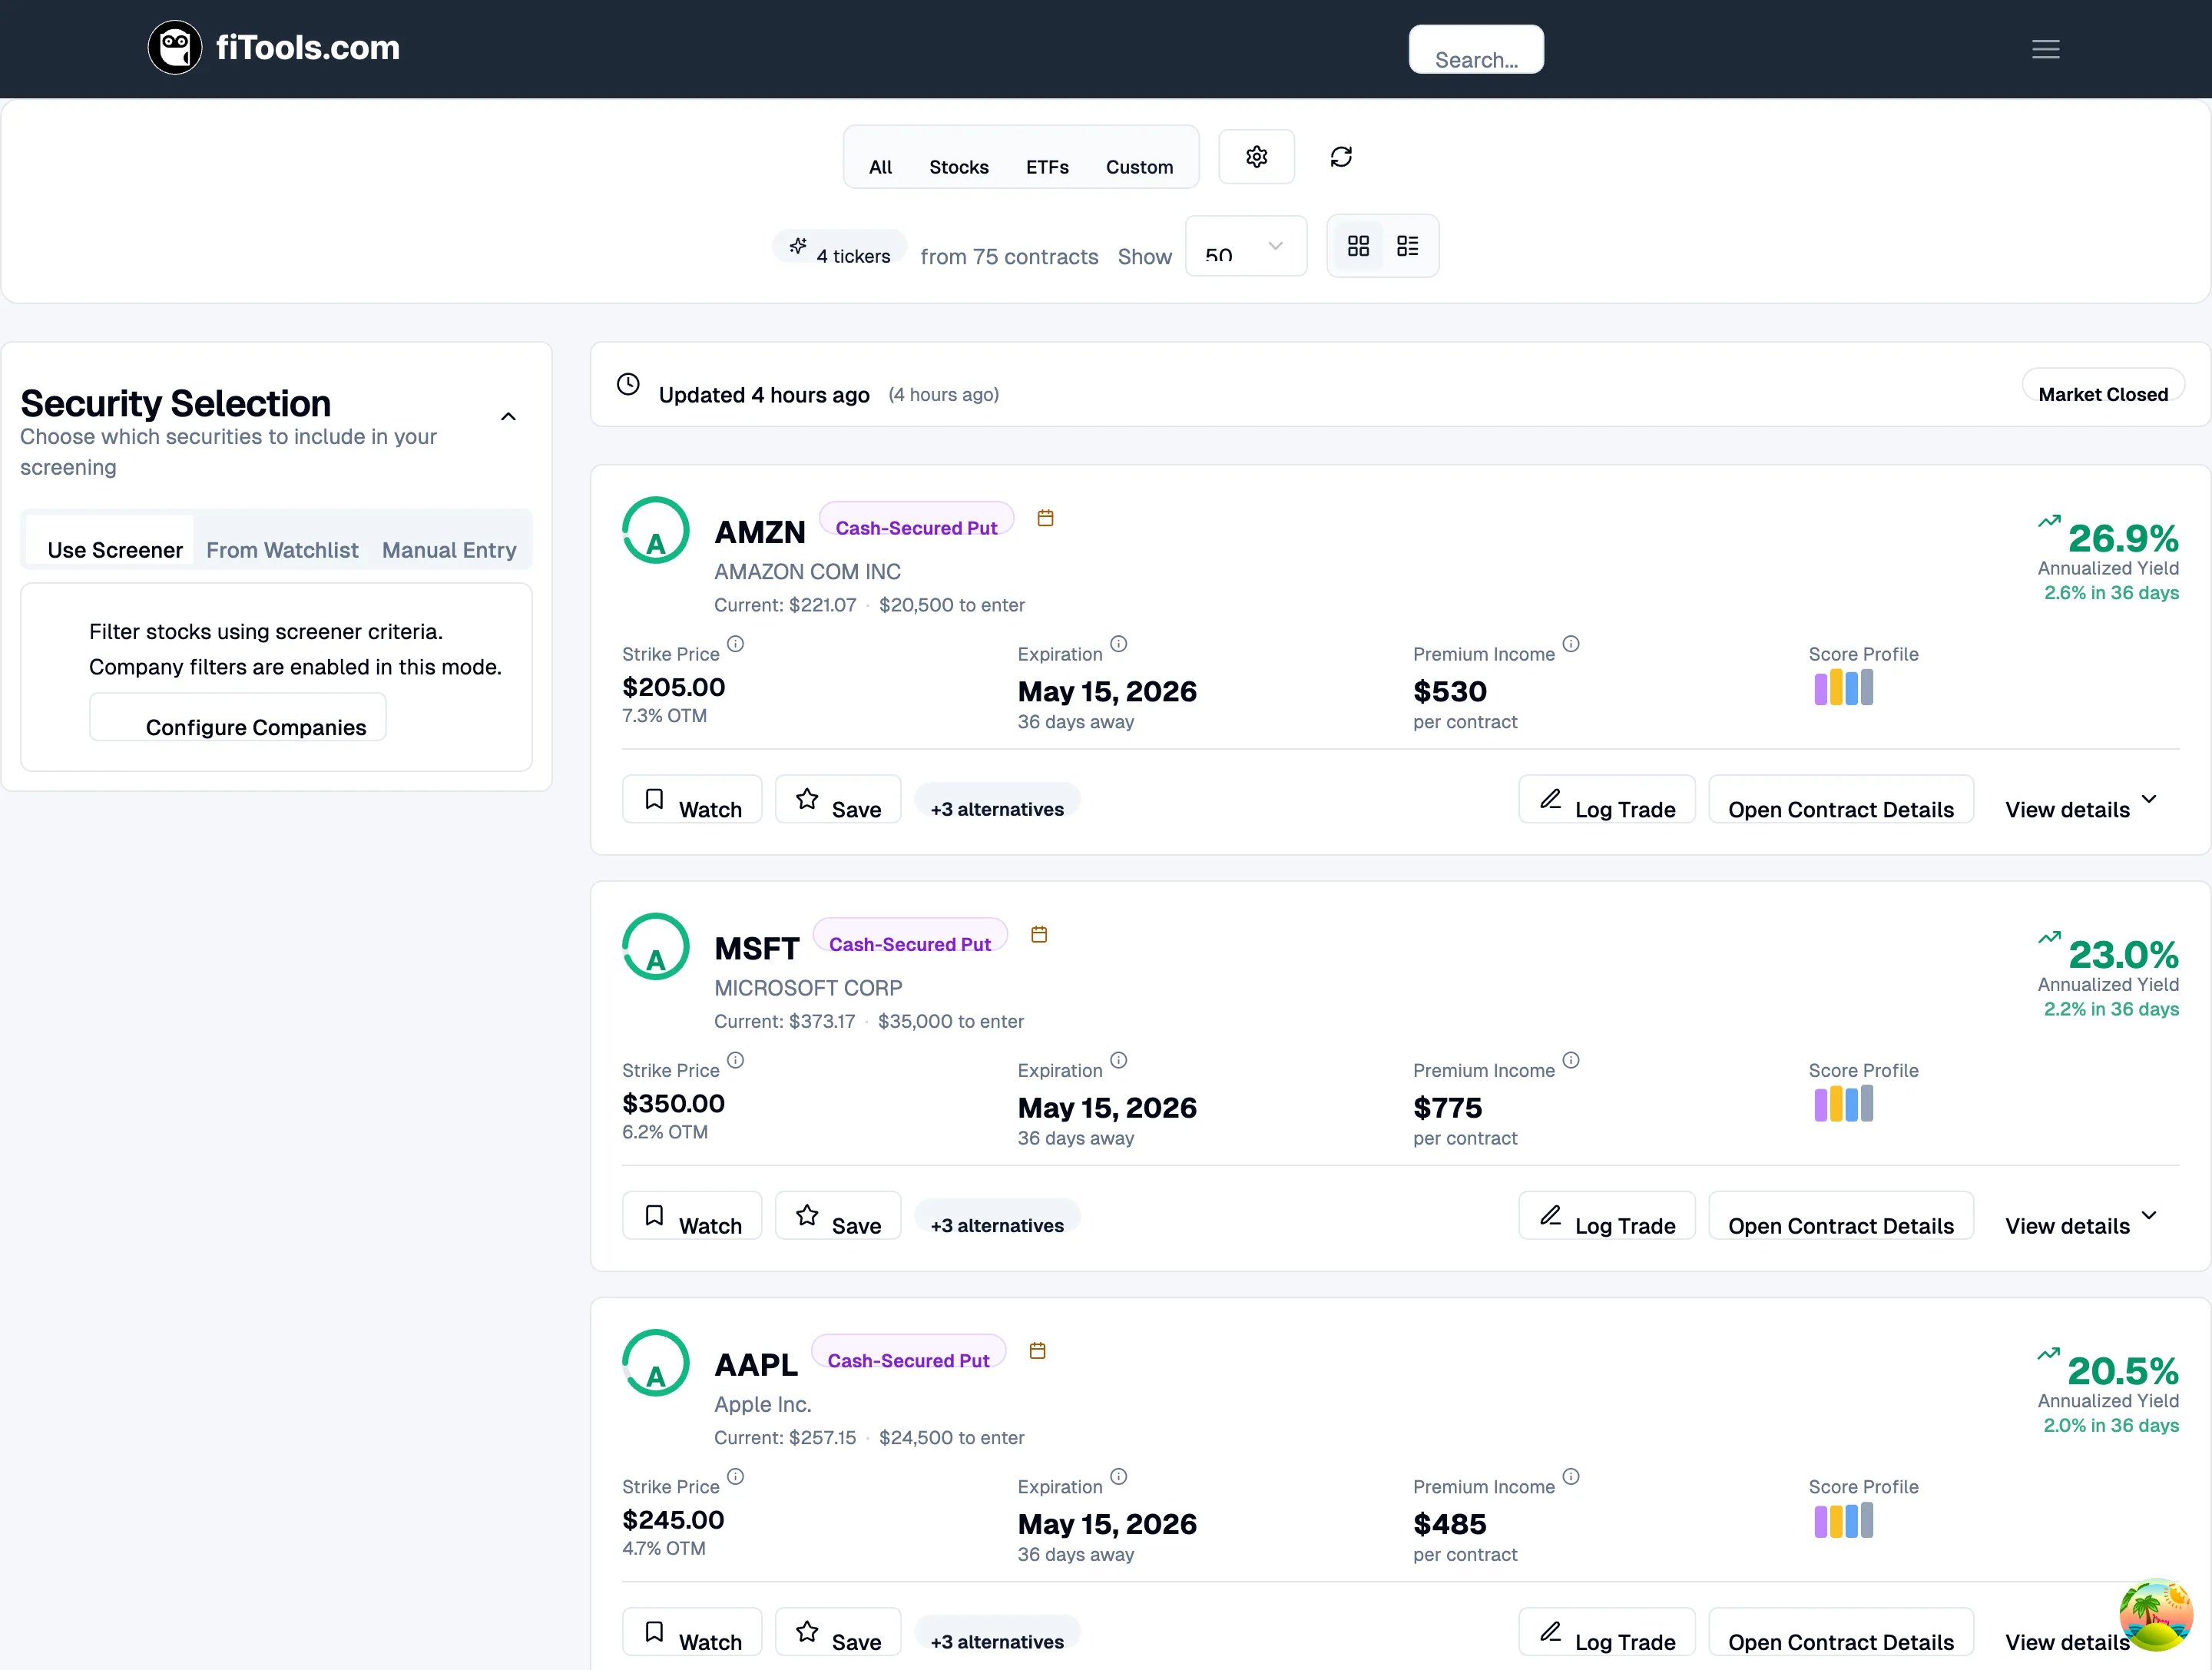
Section titled “Controls bar”The controls bar runs across the top of the page and gives you quick access to the most important settings.

From left to right you will find:
- Security tabs — choose All (stocks and ETFs together), Stocks (individual stocks only), ETFs (exchange-traded funds only), or Custom (pick your own companies).
- Filter Options — opens the Options Strategy Configuration panel where you set DTE, strike distance, yield, liquidity, and Greeks filters.
- Refresh — re-fetches the latest screener data from the server.
- Result count — shows how many tickers matched and how many contracts were scored (for example, “4 tickers from 75 contracts”).
- Show — controls how many tickers appear per page (25, 50, or 100).
- View mode — toggle between card view (grid icon) and table view (list icon).
Choosing which securities to screen
Section titled “Choosing which securities to screen”When you select Custom, a Security Selection sidebar appears on the left. It has three tabs that control which companies flow into the screener.
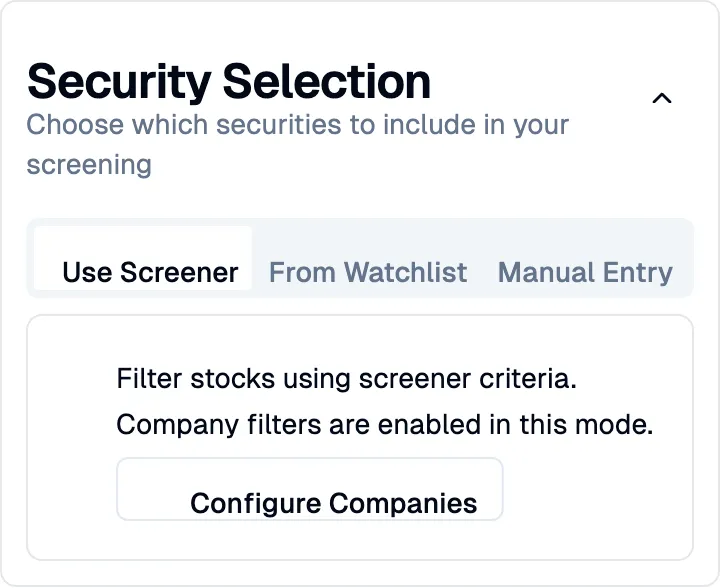
- Use Screener — filter stocks using your saved company filters (market cap, P/E, sector, and more). Click Configure Companies to adjust these filters. Company filters are organized into tabs for Fundamentals, Profitability, Valuation, Health, and Growth, plus a Sector dropdown.
- From Watchlist — screen only the tickers you have saved to your watchlist from ticker detail pages.
- Manual Entry — type in specific ticker symbols separated by commas or spaces (up to 50 tickers). Your manual list is saved automatically so it persists between sessions.
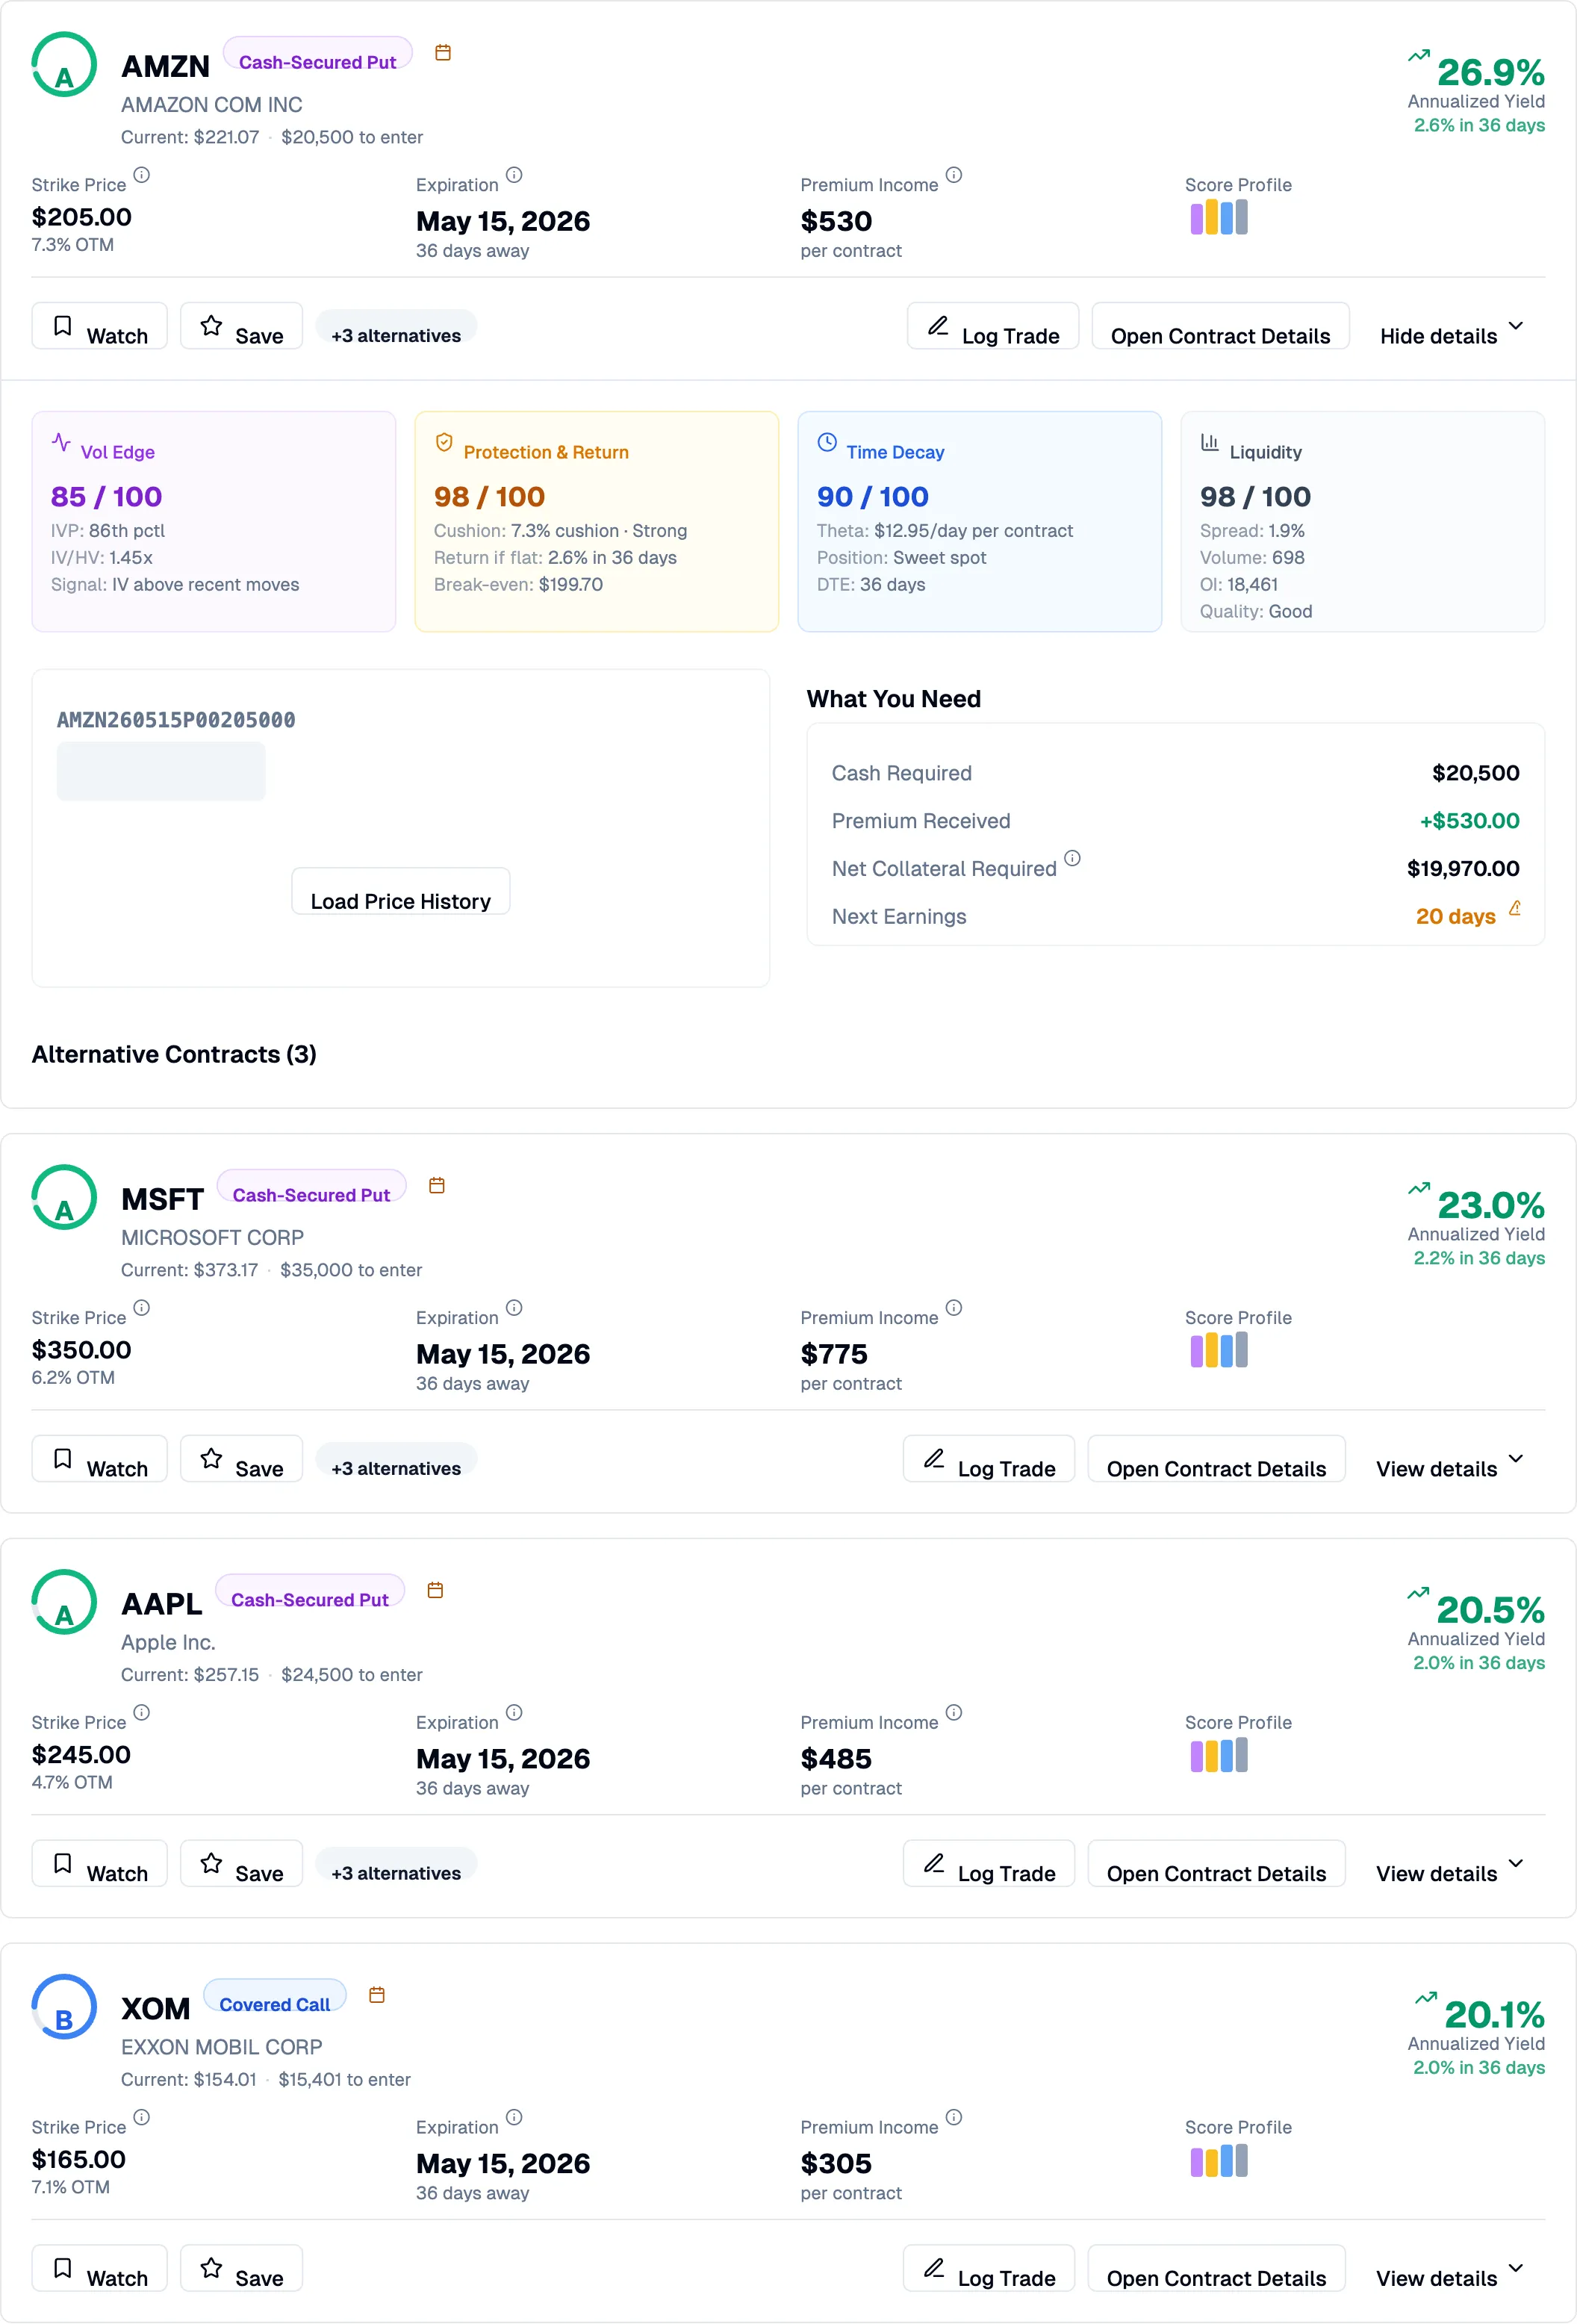
Card view
Section titled “Card view”Card view is the default layout and is designed to be approachable for newer options investors. Each result is a full-width card showing everything you need at a glance.
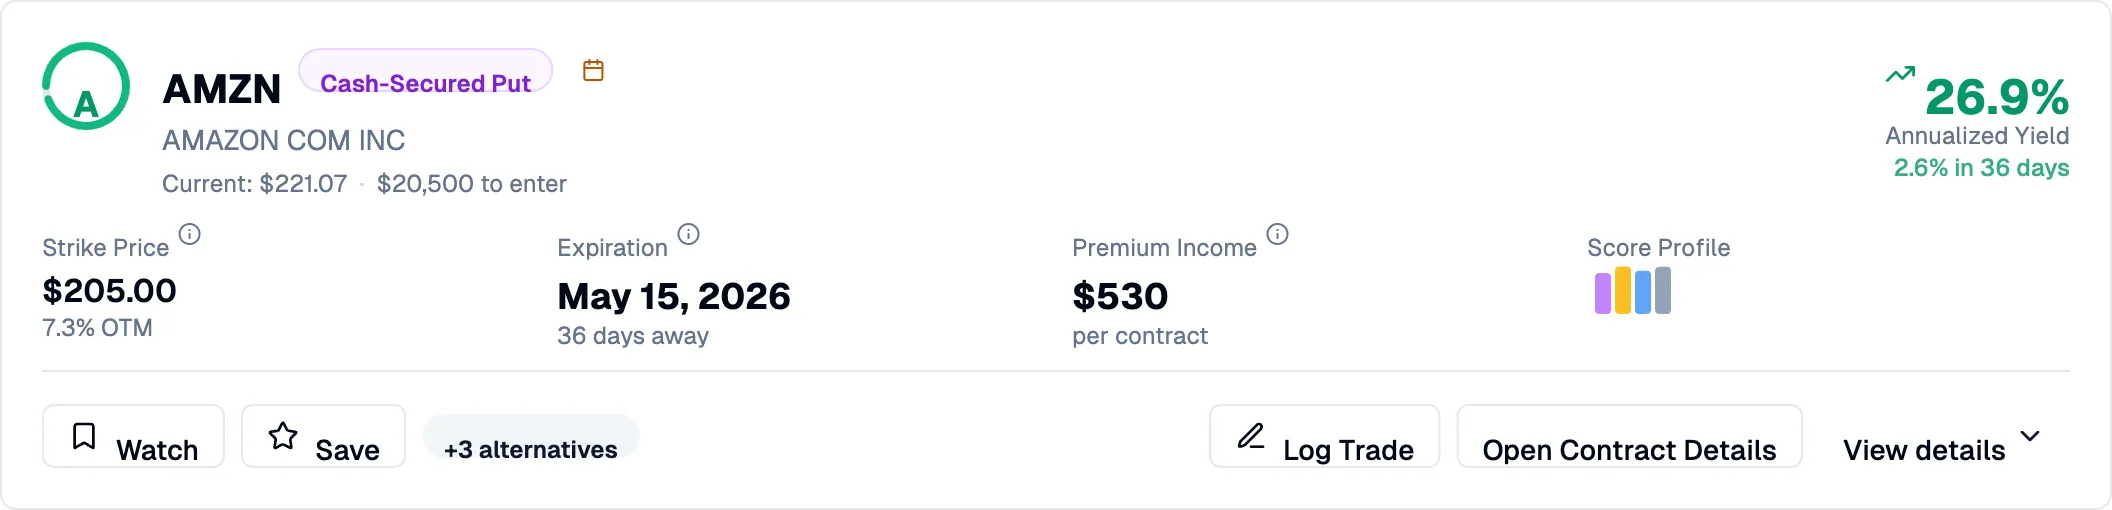
Each card displays:
- Score indicator — a letter grade (A through F) with a colored ring reflecting overall contract quality.
- Strategy badge — whether the top contract is a Covered Call or Cash-Secured Put.
- Key metrics — strike price (with distance from current price as a percentage), expiration date (with days remaining), premium income per contract, and a mini score profile with four colored bars.
- Annualized yield — the headline return figure, prominently displayed, with the period return shown below it.
- Cost to enter — the capital required to enter the position (share cost for covered calls, cash collateral for puts).
Below the metrics you will find action buttons:
- Watch — add the ticker to your watchlist for ongoing tracking.
- Save — bookmark the specific option contract.
- +N alternatives — indicates how many other contracts for this ticker scored above the quality threshold.
- Log Trade — record the trade in your portfolio if you execute it at your broker.
- Open Contract Details — navigate to the full contract detail page with scenarios, Greeks, and history.
- View details — expand the card inline to see a deeper breakdown without leaving the page.
Expanded card details
Section titled “Expanded card details”Click View details on any card to reveal the full score breakdown, position requirements, and alternative contracts.
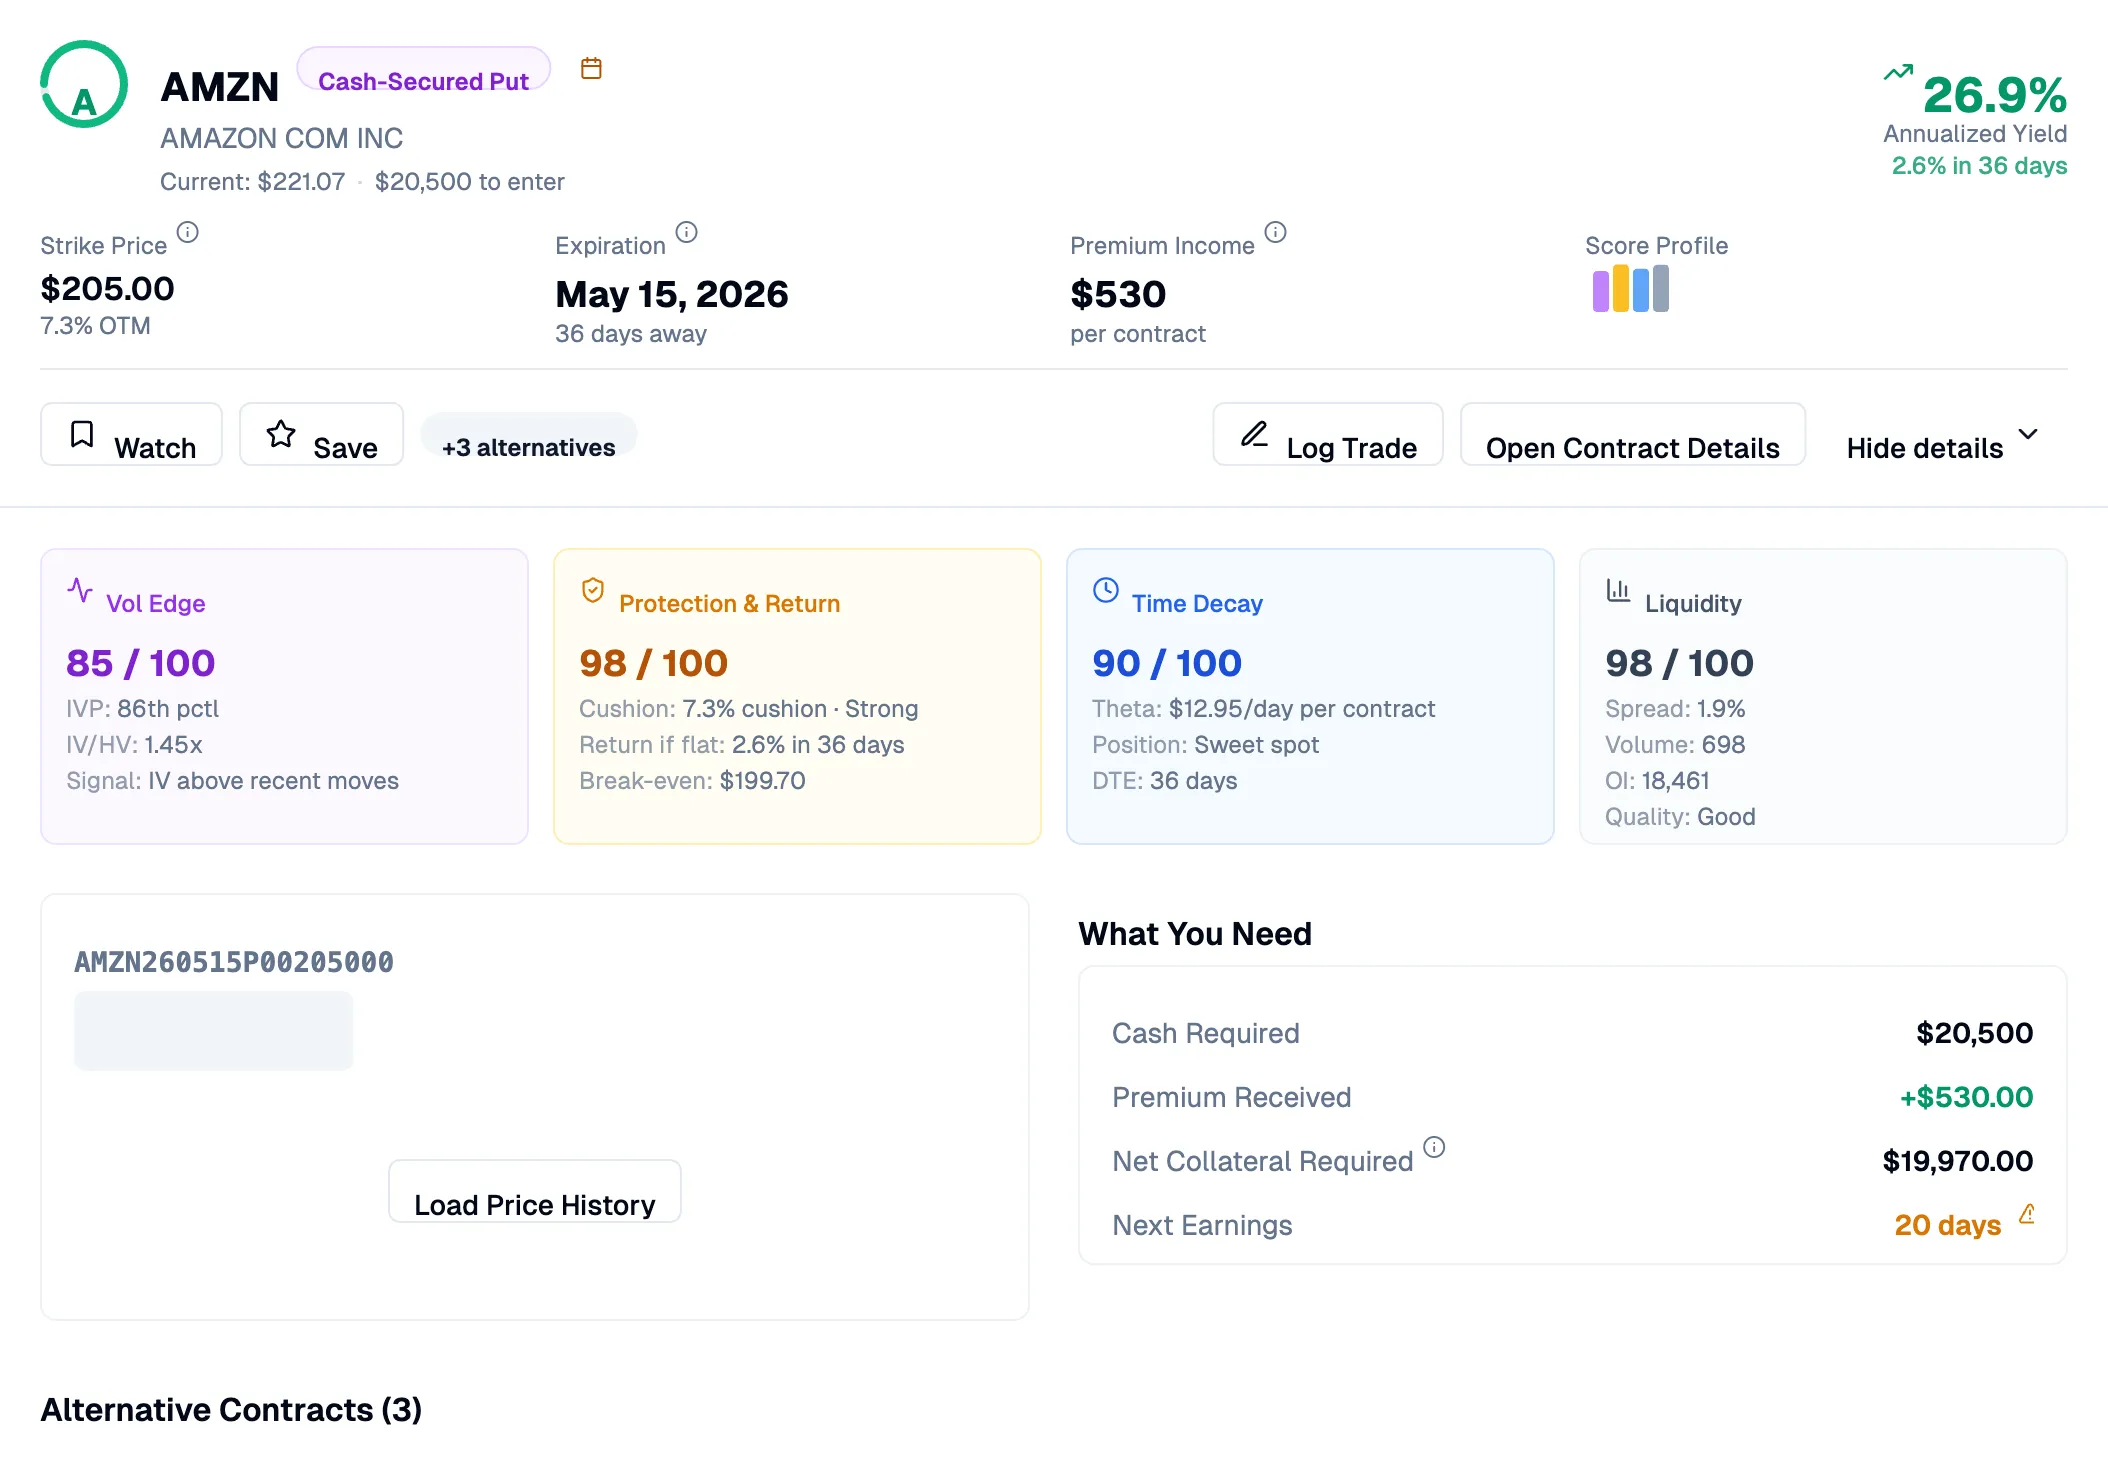
The expanded section includes:
- Four score panels — each of the four scoring dimensions with its numeric score out of 100 and the underlying data points. For example, Vol Edge shows IVP (IV percentile) and IV/HV ratio; Protection & Return shows cushion percentage, return if flat, and break-even price; Time Decay shows theta per day and the DTE position; Liquidity shows spread percentage, volume, open interest, and a quality label.
- Price chart and Greeks — tabs to load the option’s price history or view its Greek values.
- What You Need — a summary of the capital required, premium received, net collateral, and days until next earnings.
- Alternative Contracts — a table of other contracts for the same ticker that scored above the quality threshold, each with its own score, strike, expiration, yield, protection level, theta, and liquidity rating.
Table view
Section titled “Table view”Switch to table view using the list icon on the right side of the controls bar. Table view presents the same data in a compact, sortable format suited for experienced investors who want to scan many tickers quickly.
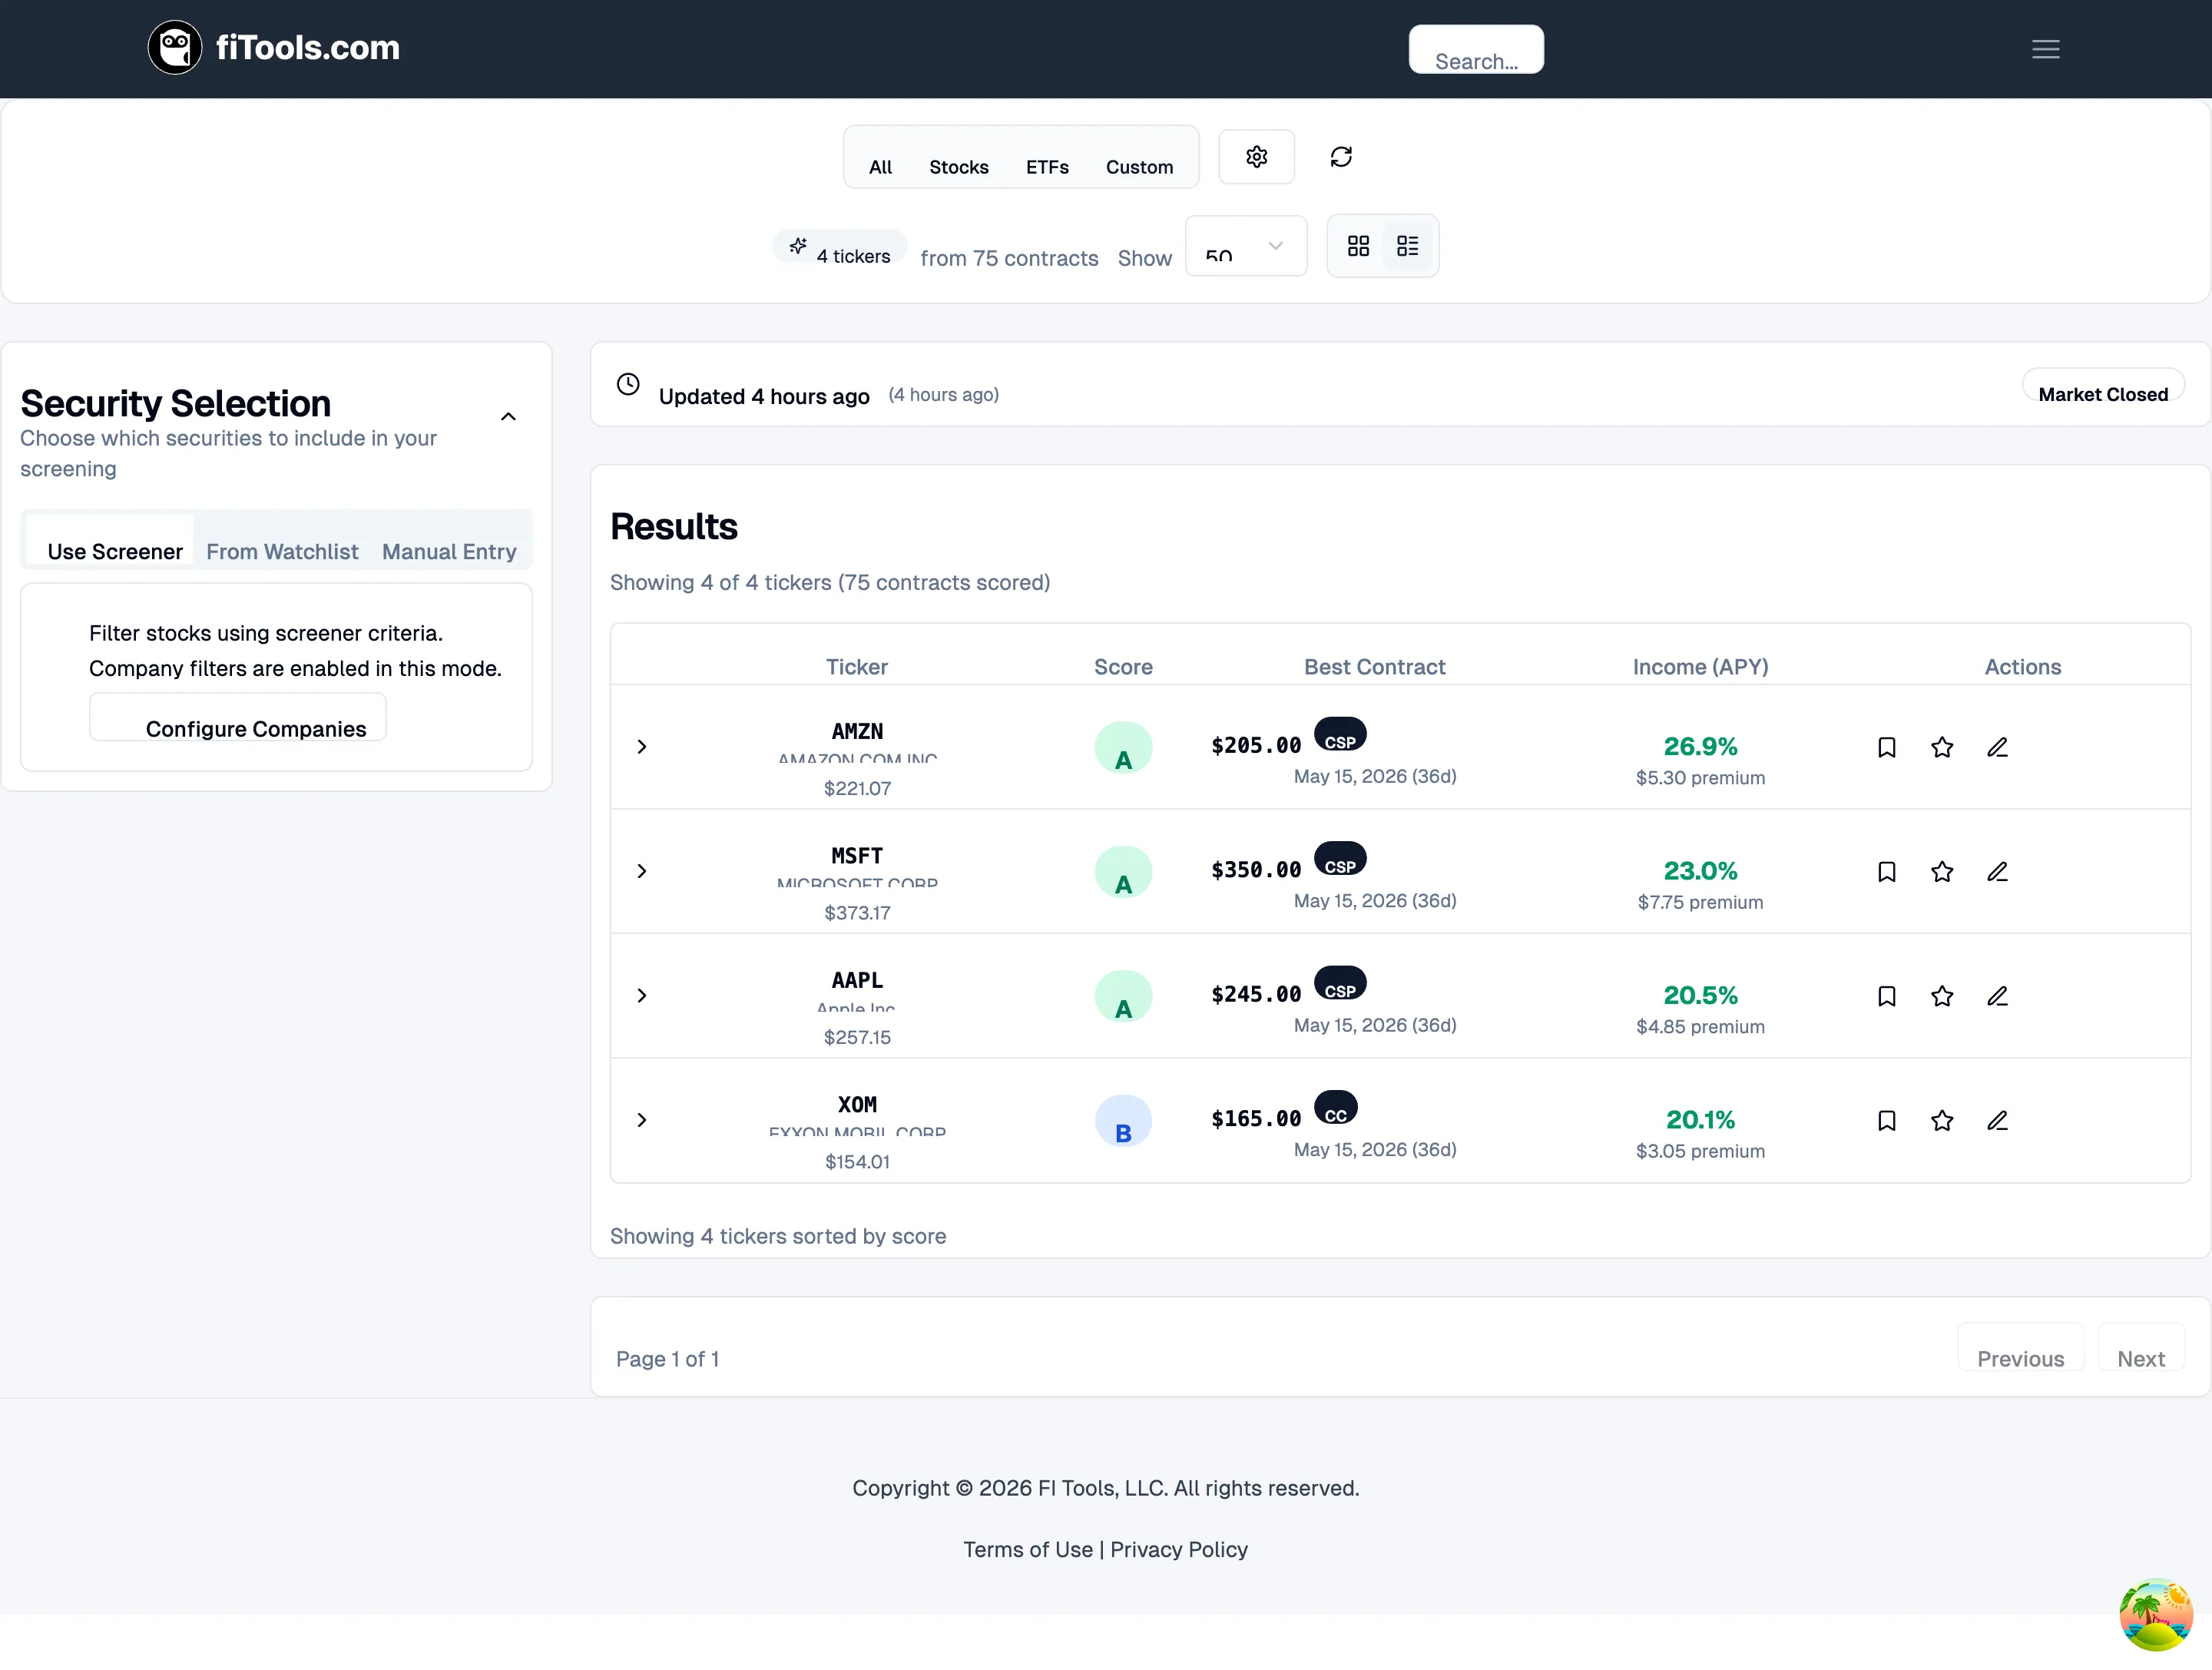
Columns include:
| Column | What it shows |
|---|---|
| Ticker | Company name, symbol, and current stock price |
| Score | Letter-grade badge (A-F) |
| Best Contract | Strike price, strategy type (CC or CSP badge), expiration, and days to expiration |
| Income (APY) | Annualized yield percentage and dollar premium per contract |
| Risk Profile | Absolute delta and count of alternative contracts |
| Actions | Watchlist, save, and log trade buttons |
Expanded table row
Section titled “Expanded table row”Click the chevron on any row to expand it. The expanded section has three tabs:
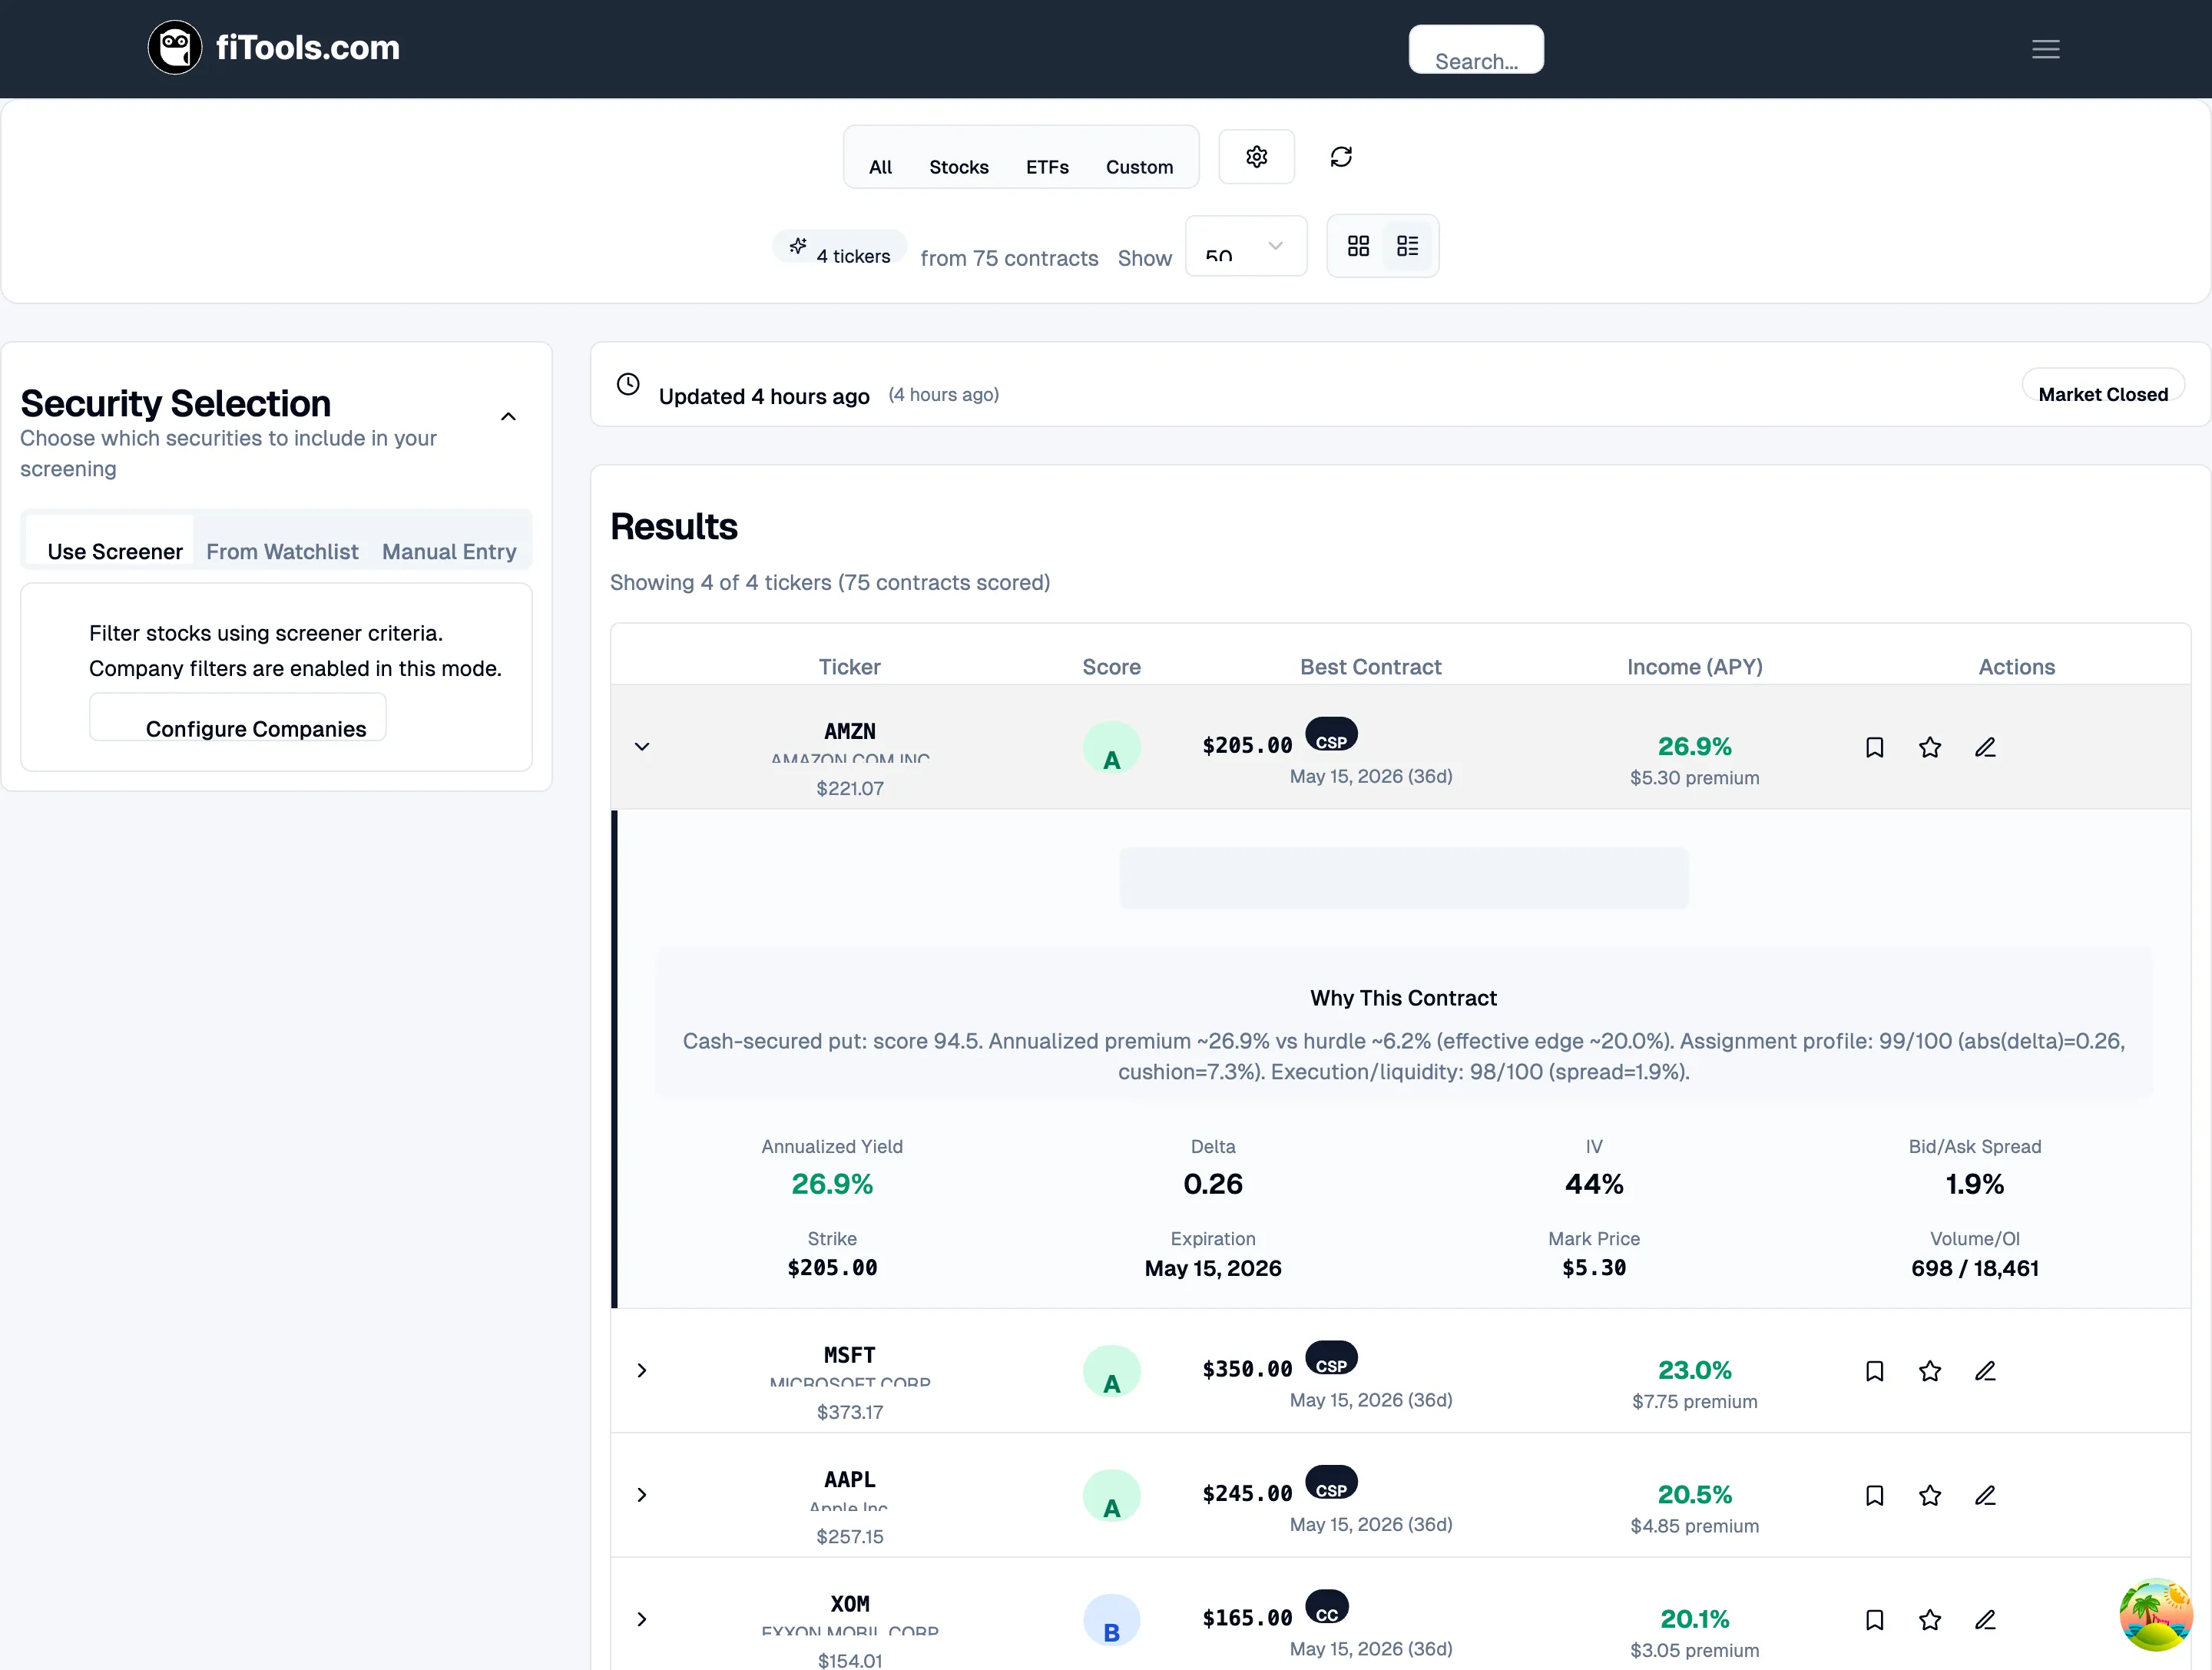
- Selected Contract — full details including a plain-English rationale (“Why This Contract”), annualized yield, delta, IV, bid-ask spread, strike, expiration, mark price, and volume/open interest.
- Alternatives — other contracts for the same ticker that scored above the quality threshold, each with its own score, strike, expiration, yield, and delta.
- Ticker Info — company name, sector, security type, current price, strike distance, and days until next earnings.
Understanding the score
Section titled “Understanding the score”Every contract receives an overall score from 0 to 100, displayed as a letter grade. The score is built from four equally weighted components:
- Vol Edge — measures whether implied volatility is elevated relative to historical volatility, giving you a pricing edge as a seller. Shown as IVP (IV percentile) and IV/HV ratio.
- Protection & Return — evaluates the cushion between the current price and your strike, the return you earn if the stock stays flat, and the break-even price.
- Time Decay — rates how efficiently theta is working in your favor. Contracts in the 20-45 DTE window score highest because time decay accelerates most in that range.
- Liquidity — checks bid-ask spread, daily volume, and open interest to make sure you can enter and exit at a fair price.
Score tiers
Section titled “Score tiers”| Grade | Label | Description |
|---|---|---|
| A | Excellent | Highest-scoring contracts across all four dimensions |
| B | Good | Strong opportunities with minor trade-offs |
| C | Acceptable | Decent but with noticeable weakness in one area |
| D | Marginal | Weak in one or more dimensions |
| F | Avoid | Below quality threshold |
Filtering your results
Section titled “Filtering your results”Click Filter Options in the controls bar to open the Options Strategy Configuration panel. Filters are organized into groups, and each filter has an Enable checkbox — disabled filters are ignored, letting you focus only on the criteria that matter to you.
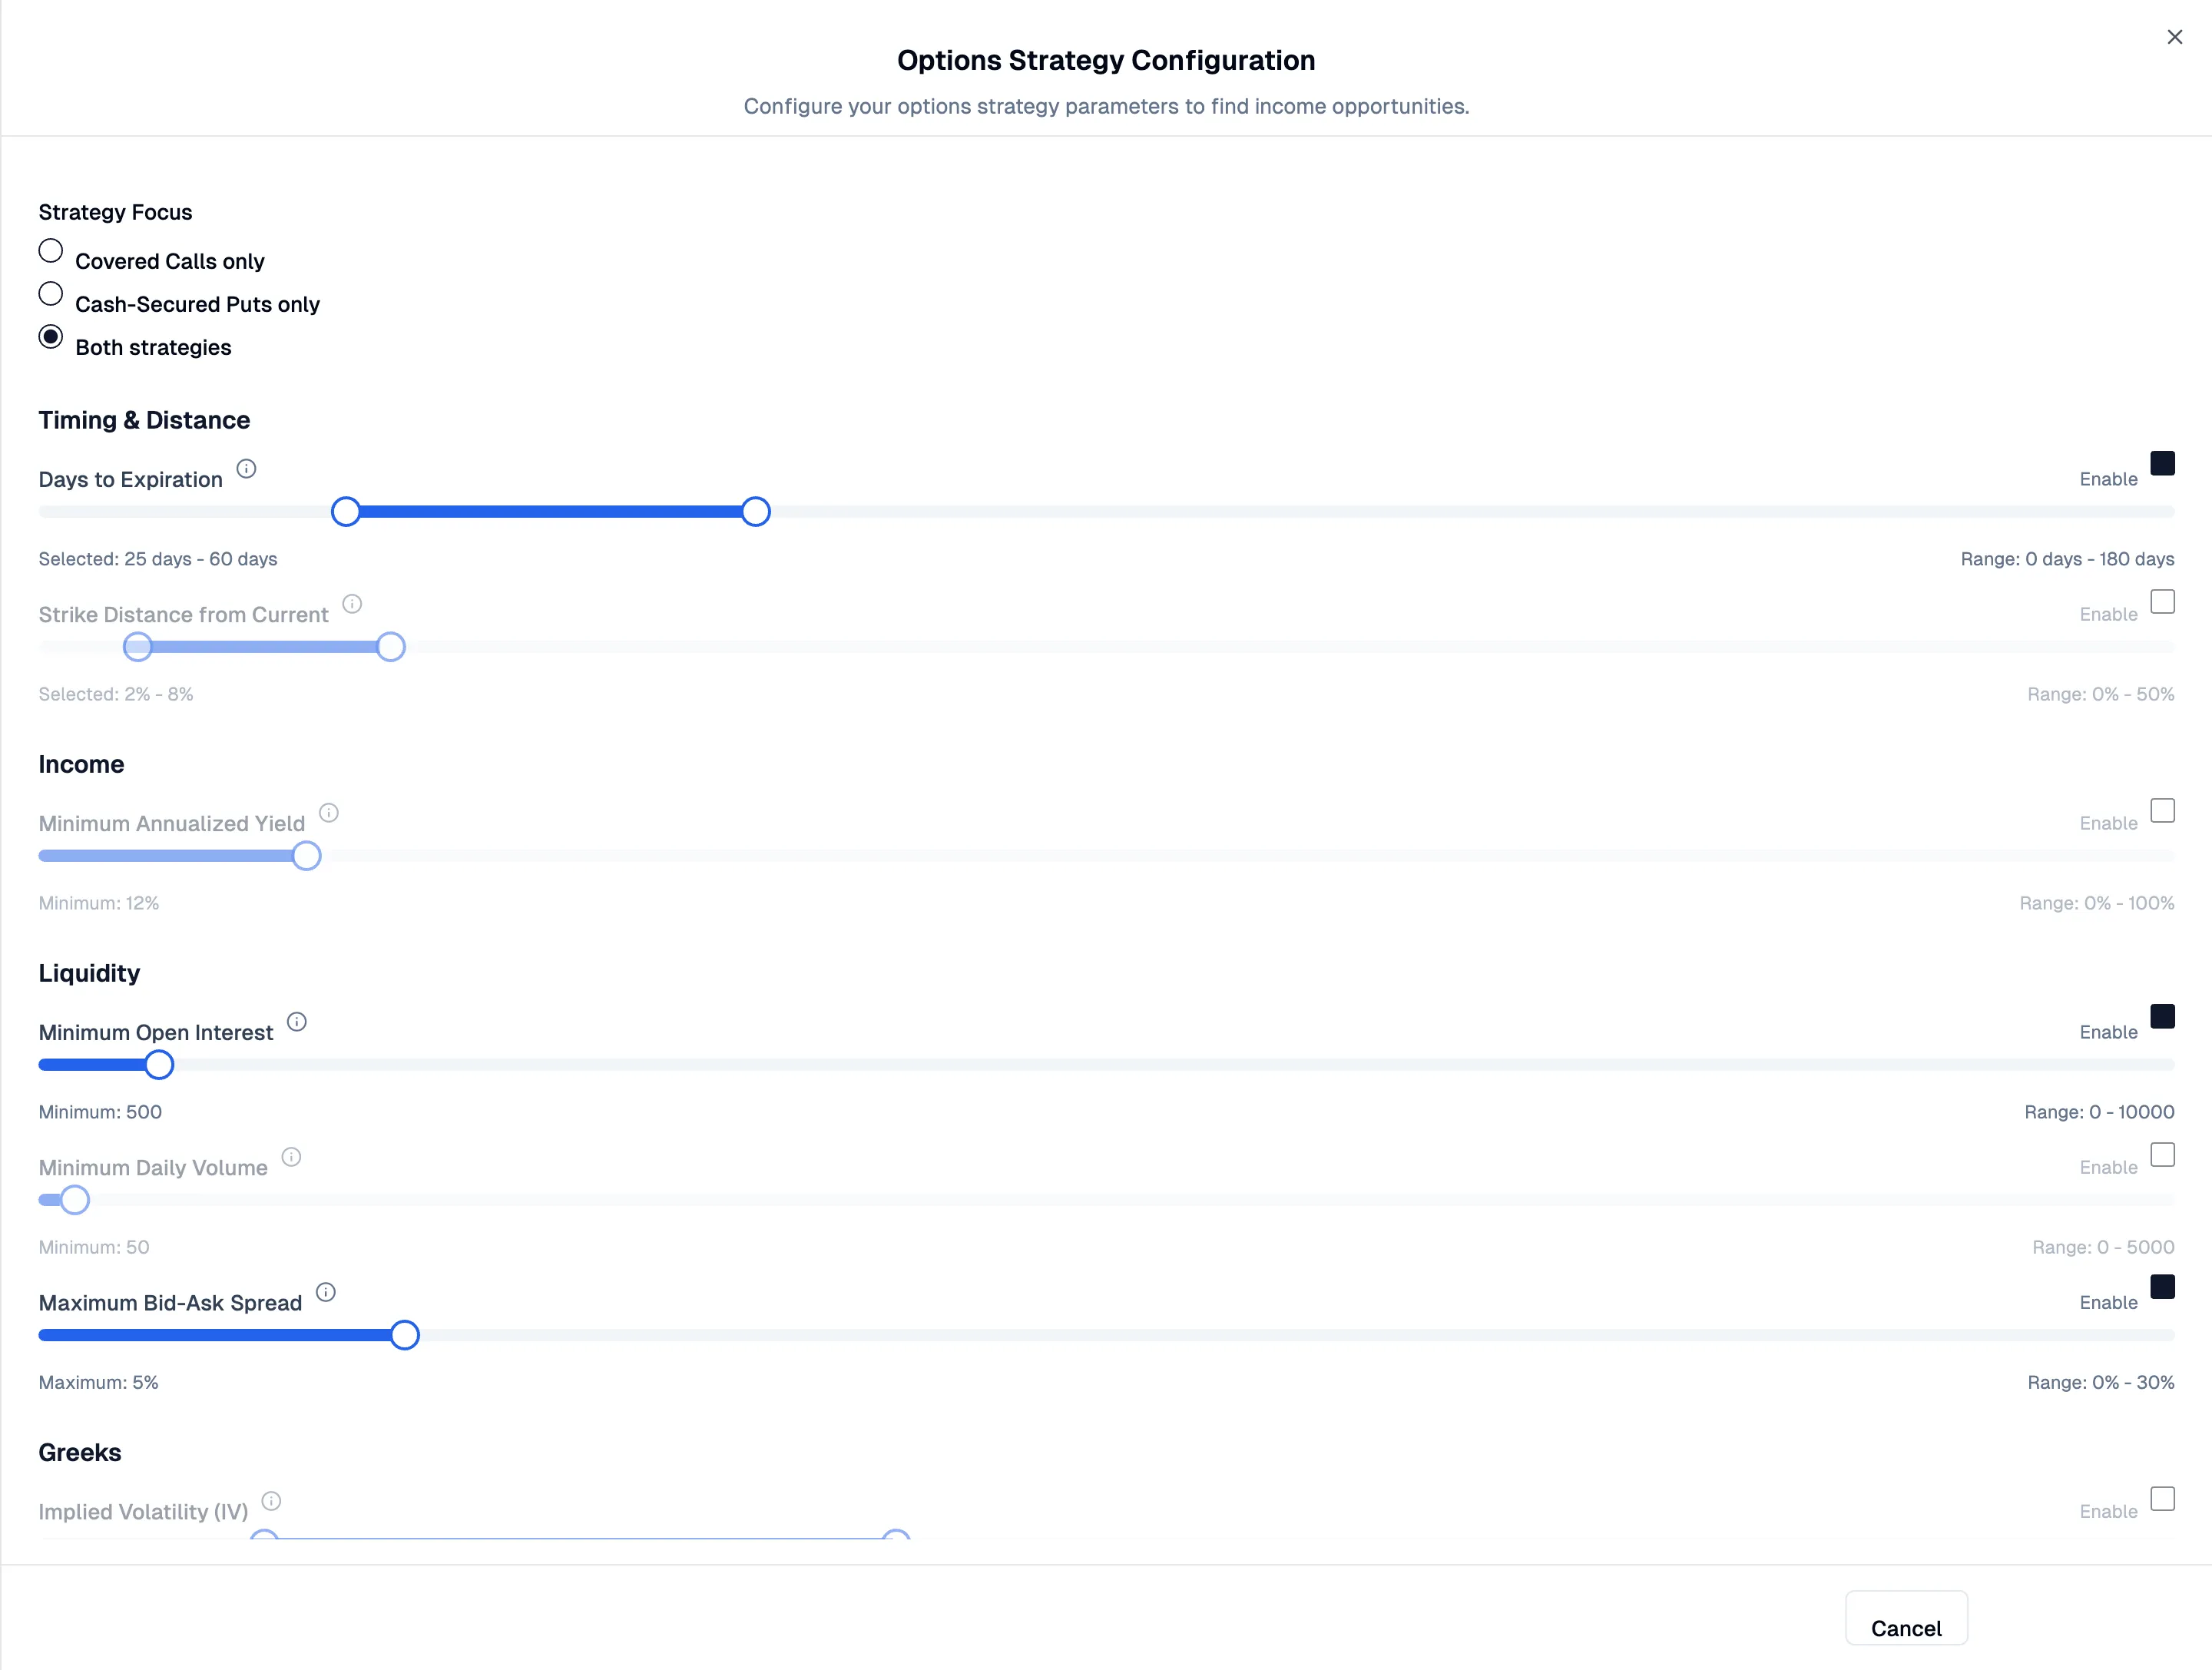
Strategy Focus
Section titled “Strategy Focus”Choose which types of trades to see:
- Covered Calls only — screen for call options to sell against shares you own.
- Cash-Secured Puts only — screen for put options to sell with cash collateral.
- Both strategies — show the best contract regardless of type.
Timing and Distance
Section titled “Timing and Distance”- Days to Expiration (DTE) — set a minimum and maximum range (0-180 days). The sweet spot for time decay is typically 25-45 days.
- Strike Distance from Current — how far out-of-the-money the strike should be as a percentage of the current price (0-50%).
Income
Section titled “Income”- Minimum Annualized Yield — set a floor for the annualized return (0-100%). Contracts below this threshold are filtered out.
Liquidity
Section titled “Liquidity”- Minimum Open Interest — require a minimum number of outstanding contracts (0-10,000).
- Minimum Daily Volume — require a minimum number of contracts traded per day (0-5,000).
- Maximum Bid-Ask Spread — cap the spread as a percentage (0-30%). Tighter spreads mean better execution prices.
Greeks
Section titled “Greeks”- Implied Volatility (IV) — filter by IV range (0-200%). Higher IV means more premium but also more risk.
- Delta (absolute) — filter by the probability proxy (0-1). Lower absolute delta means the option is further out of the money.
- Theta (Time Decay) — filter by the daily decay rate.
- Gamma — filter by the rate of delta change.
Other Filters
Section titled “Other Filters”- Moneyness — limit results to ITM (In The Money) or OTM (Out of The Money) contracts.
- Exclude earnings — remove contracts that expire after an upcoming earnings announcement. Earnings events can cause large price swings that work against option sellers.
Data freshness
Section titled “Data freshness”A banner below the controls bar shows when the screener data was last updated and the current market status (open or closed). Options data is refreshed throughout the trading day. During extended market closures (holidays), the screener displays a message explaining that data is temporarily unavailable.
Taking action on results
Section titled “Taking action on results”From any result — whether in card view or table view — you can:
- Watch the ticker — click the bookmark icon to add the stock to your watchlist so it appears on your dashboard.
- Save the contract — click the star icon to bookmark the specific option contract for later review.
- Log a trade — click the pen icon to record the trade in your FITools portfolio. This opens a pre-filled trade entry form with the contract details already populated.
- View contract details — click through to the full contract detail page for scenario analysis, Greek breakdowns, and historical context.
Pagination
Section titled “Pagination”Results are paginated. You can control how many tickers appear per page (25, 50, or 100) using the Show dropdown in the controls bar. Navigate between pages with the Previous and Next buttons at the bottom of the results.
Related pages
Section titled “Related pages”- How Covered Calls Work — learn the mechanics behind selling covered calls
- How Cash-Secured Puts Work — understand cash-secured put strategy
- Strikes and Expirations — guidance on selecting the right strike and expiration